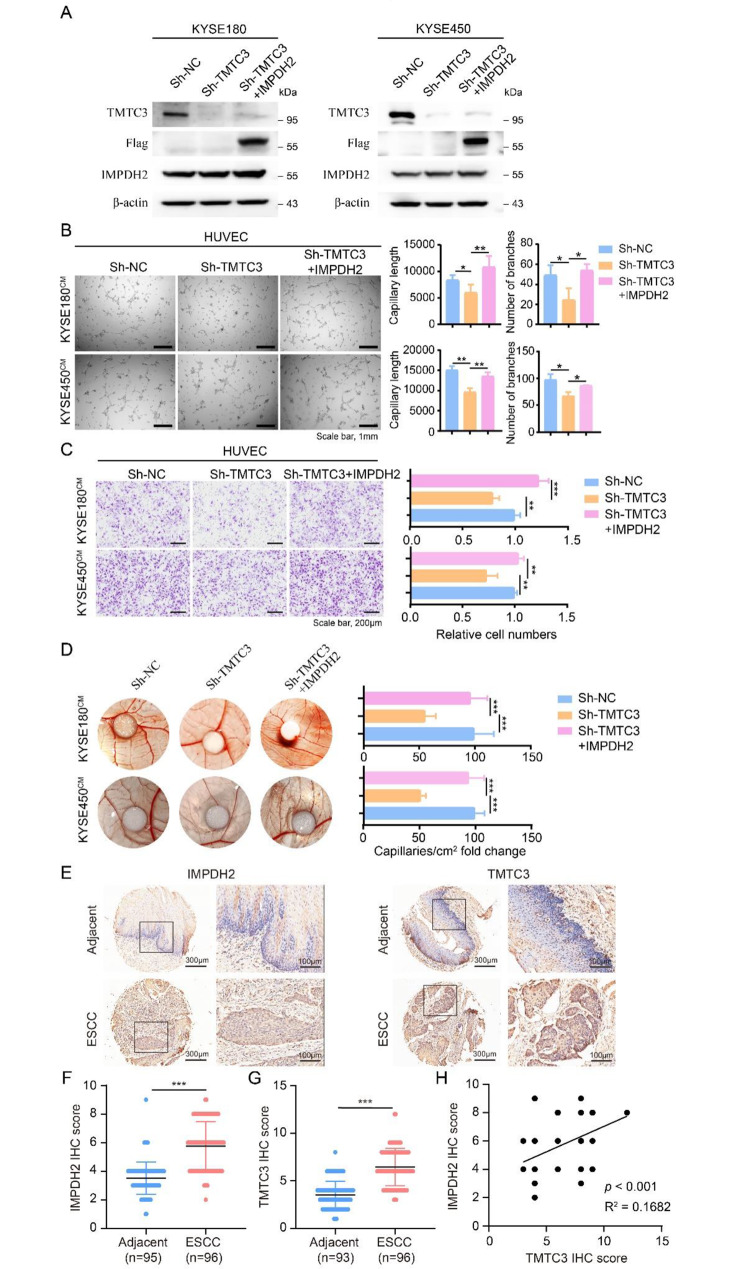
Fig. 4.
IMPDH2 overexpression relieved the angiogenesis inhibition caused by TMTC3 knockdown. (A) The overexpression efficiency of IMPDH2 in TMTC3 knockdown cells. (B) Representative micrographs of the HUVECs tube formation treated with indicated condition medium (left). Quantification of the capillary length and number of branches (right). (C) The migration ability of HUVECs was measured by transwell assay as described in Materials and Methods. The number of migrated cells were counted by Image J software. (D) Representative images of the blood vessels formed in the CAM assay, after incubation with conditioned medium from the indicated cells. The results are summarized in the graphs as vessel density. (E) Representative IHC images for IMPDH2 and TMTC3 in ESCC tissue array. F and G. IHC staining score for IMPDH2 (F) and TMTC3 (G). H. Correlation of IMPDH2 IHC score and TMTC3 IHC score. All data are expressed as the mean ± SD. *, p < 0.05; **, p < 0.01; ***, p < 0.001. n = 3

