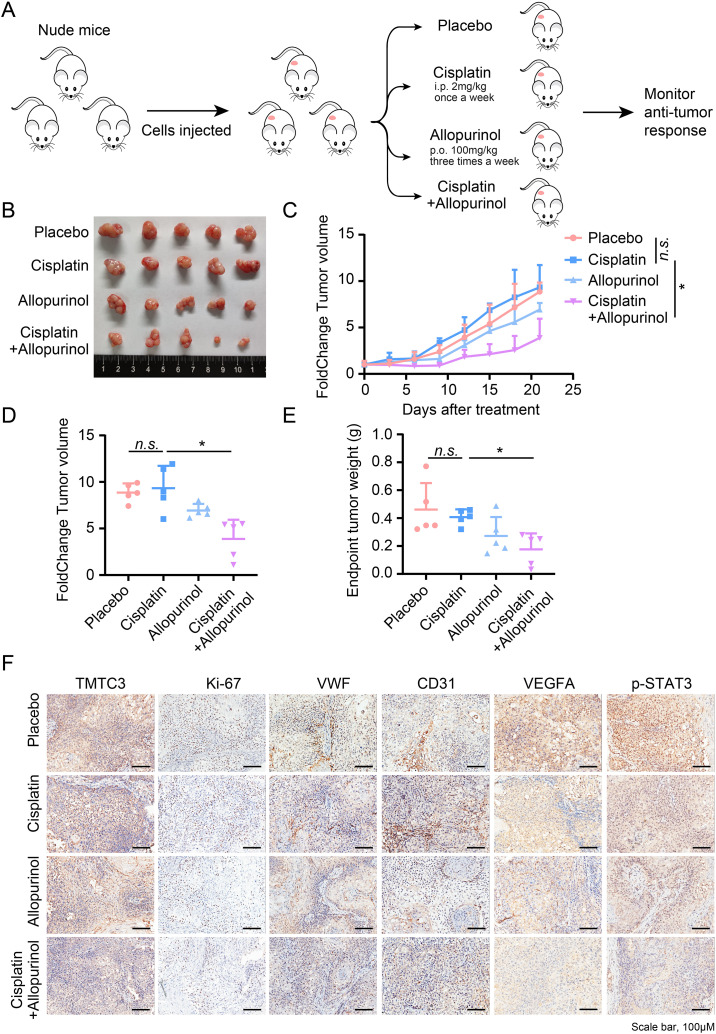
Fig. 7.
Effects of allopurinol and cisplatin on tumor growth in KYSE450 xenograft model. (A) Schematic of mouse studies. (B) Representative tumor images of each group at the end of treatment. (C) Curves of percent change in tumor volume for each group. (D) Dot plot of percent change in tumor volume at the end of the experiment. (E) Dot plot of tumor weight at the end of the experiment. (F) Representative images of TMTC3, Ki67, VWF, CD31 and p-STAT3 staining in KYSE450 xenografts. All data are expressed as the mean ± SD. n.s., no significance; *, p < 0.05; **, p < 0.01. n = 5

