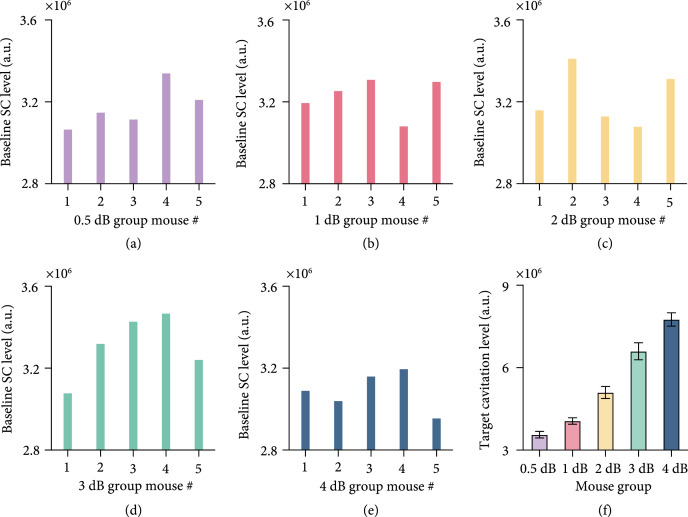
Figure 1.
Baseline stable cavitation levels. (a–e) Baseline stable cavitation level of each subject in the five groups with different target cavitation level (i.e., 0.5 dB, 1 dB, 2 dB, 3 dB, or 4 dB). (f) The bar plot shows the mean and standard deviation of the target cavitation level for the five groups of mice.

