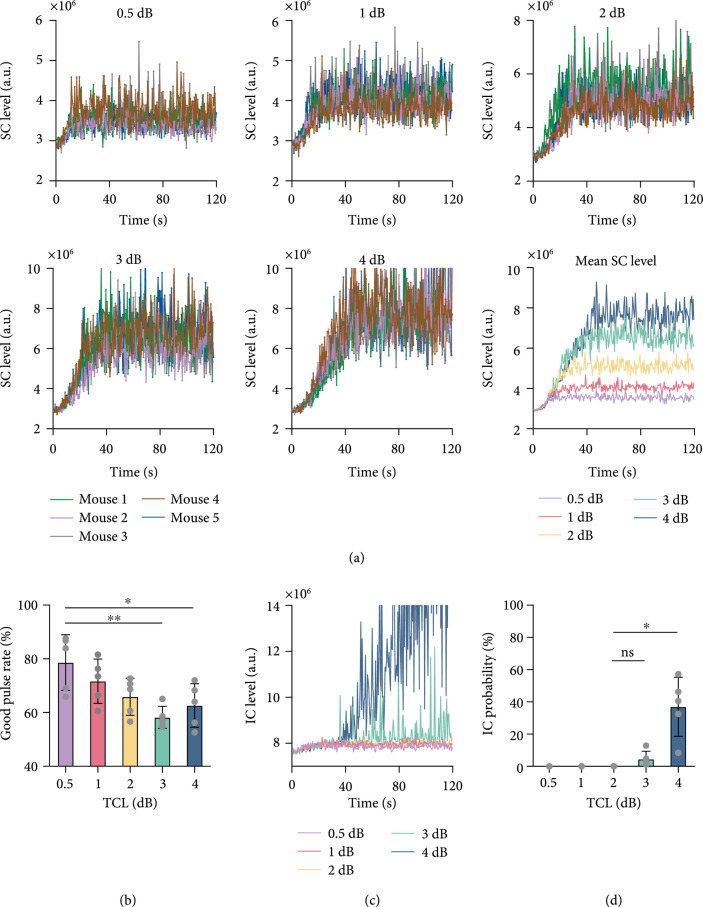
Figure 2.
Performance of the proposed feedback control algorithm. (a) Stable cavitation level as a function of time at different target cavitation levels (i.e., 0.5 dB, 1 dB, 2 dB, 3 dB, or 4 dB above baseline stable cavitation level). Each color represents the stable cavitation level obtained from each mouse. The last graph shows the average stable cavitation level for each target cavitation level group. (b) Good pulse rate of the feedback control algorithm at each target cavitation level. (c) The average inertial cavitation level at each target cavitation level. (d) Inertial cavitation probability at different target cavitation levels. The bar plot in (b) and (d) shows the mean and standard deviation. Each circular point represents the result obtained from one mouse (Tukey’s test ; ; ns/no label: not significant).

