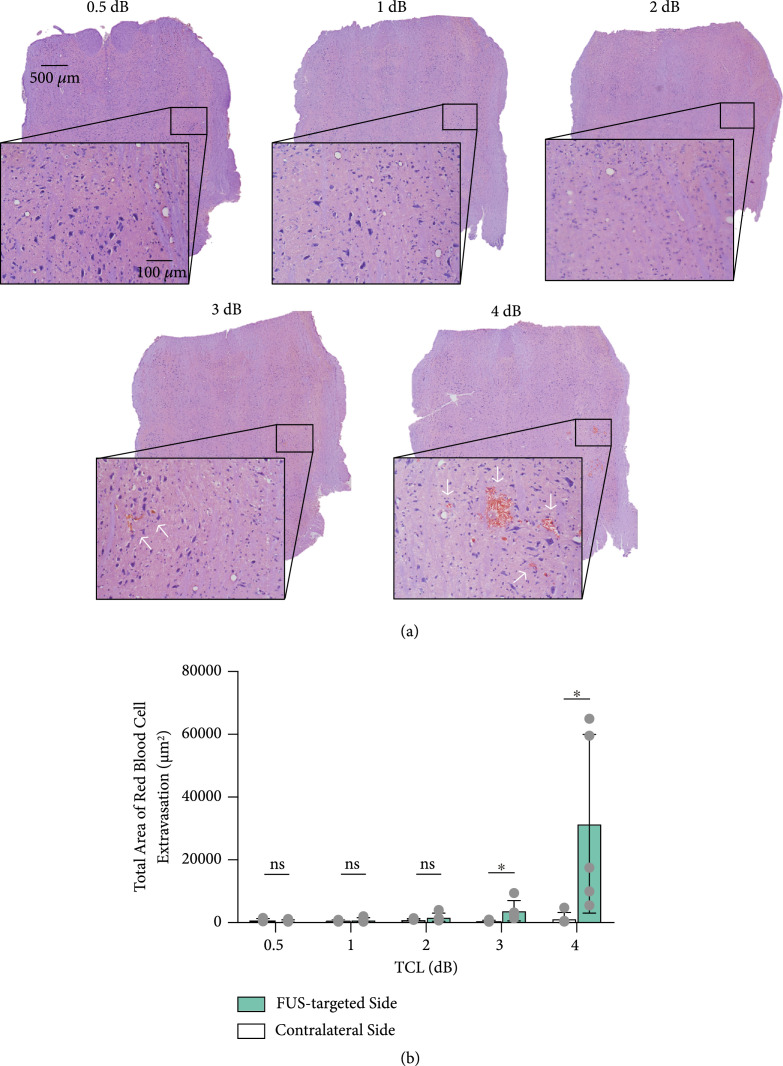
Figure 4.
Safety analysis. (a) Representative H&E staining of the FUS-targeted side of the brainstem at each target cavitation level. (b) Comparison of hemorrhage area of each target cavitation level and the contralateral side. The bar plot in (b) shows the mean and standard deviation. Each circular point represents the result obtained from each mouse (Tukey’s test ; ns: not significant).

