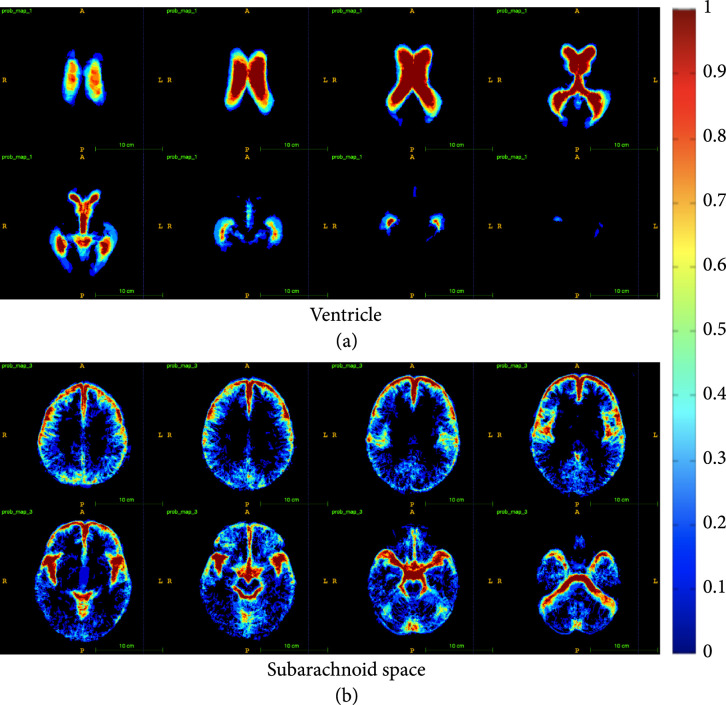
Figure 6.
Probability maps for the ventricle (a) and subarachnoid (b) classes. Each image shows one slice in the dimension. The progression of the images (column-wise, then row-wise) goes from the top of the brain to the bottom of the brain. Blue colors represent lower values while red colors represent higher values. Black represents a value of zero. The legend bar has been scaled to (0,1).

