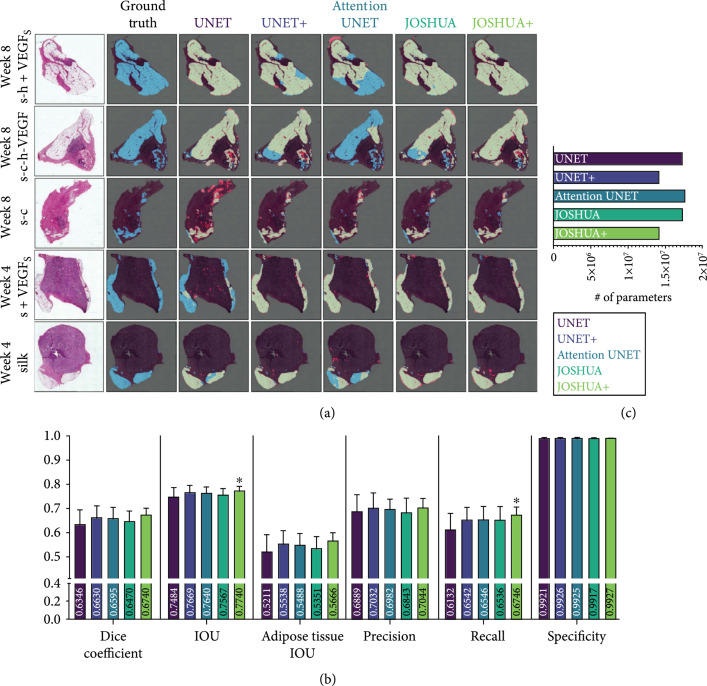
Figure 3.
(a) Example segmentation results from each model on the SFBHI dataset. The first column displays the input image, and the corresponding ground truth label for the input image is shown in the second column. The remaining columns display the output from each model in comparison to the ground truth. Blue pixels correspond to the ground truth and red pixels correspond to the predicted output. Light green pixels indicate that both the ground truth and predicted output agree. (b) Dice coefficient, IOU, adipose tissue IOU, precision, recall, and specificity metrics for each model for SFBHI dataset. As shown here, the histogram models (JOSHUA/JOSHUA+) and UNET+ improve segmentation results compared to the baseline UNET and attention UNET [16] models. Metrics are shown as . A one-way analysis of variance followed by Dunnett’s multiple comparison test was computed. The asterisks () indicate significant differences as compared to UNET (). (c) We also evaluated the number of learnable parameters for each CNN model. The attention-inspired variants have approximately fewer parameters than their counterparts.

