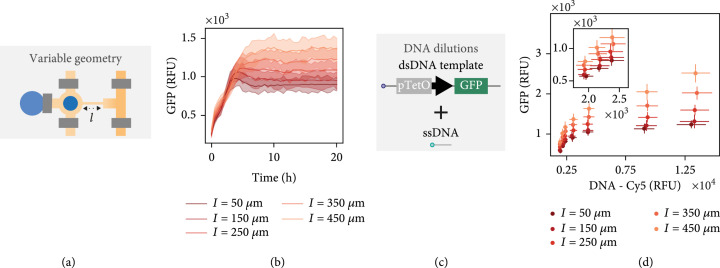
Figure 2.
CFPU characterization and applications. (a) Protein expression using a single DNA template was carried out on-chip in order to characterize the effect of variable connecting channel lengths. (b) GFP expression versus time shown for a single DNA concentration and different connecting channel lengths. (c) DNA dilutions are made by mixing different ratios of dsDNA templates with short biotinylated ssDNA oligos. (d) The steady-state GFP expression level versus the Cy5 fluorescence signal of dsDNA template attached to the surface for all connecting channel lengths and DNA dilutions. The inlaid plot shows the three lowest DNA concentrations. The lines or points shown in (b, d) represent mean ().

