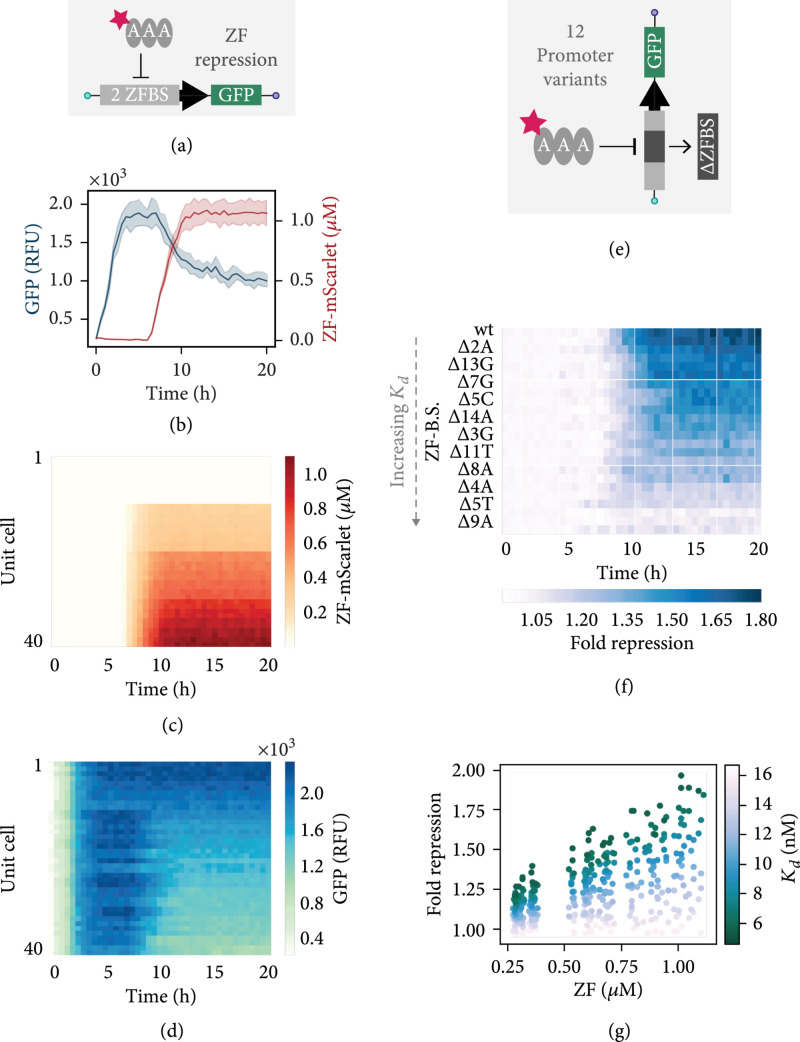
Figure 3.
ZF combinatorics. (a) PWM is used to mix three components on-chip to generate different concentrations of an mScarlet-tagged ZF which is then screened against a target template with two ZF binding sites in the promoter. (b) Example of time-lapse traces for GFP expression and ZF-mScarlet signal. The lines represent the mean (), where the SD is designated by the shaded regions. (c) ZF-mScarlet concentration over time for all unit cells containing a target template with two ZF binding sites in the promoter. (d) GFP expression versus time for the same unit cells shown in the preceding plot. (e) Multiple targets can be screened simultaneously on-chip, including promoter variants that contain mutated ZF binding sites. (f) Fold repression over time for targets containing modified ZF binding sites, shown in order of increasing , with the wild type binding site sequence at the top. The fold repression is calculated by dividing the signal obtained from no added ZF by the signal obtained from the highest quantity of added ZF (duty ). The time-lapse data shown in this plot corresponds to unit cells with a connecting channel length of μm. (g) All end point fold repression values calculated for each duty cycle and connecting channel length, plotted according to the ZF binding site . Data shown in panels (f, g) was collected using two chips and represent the mean ().

