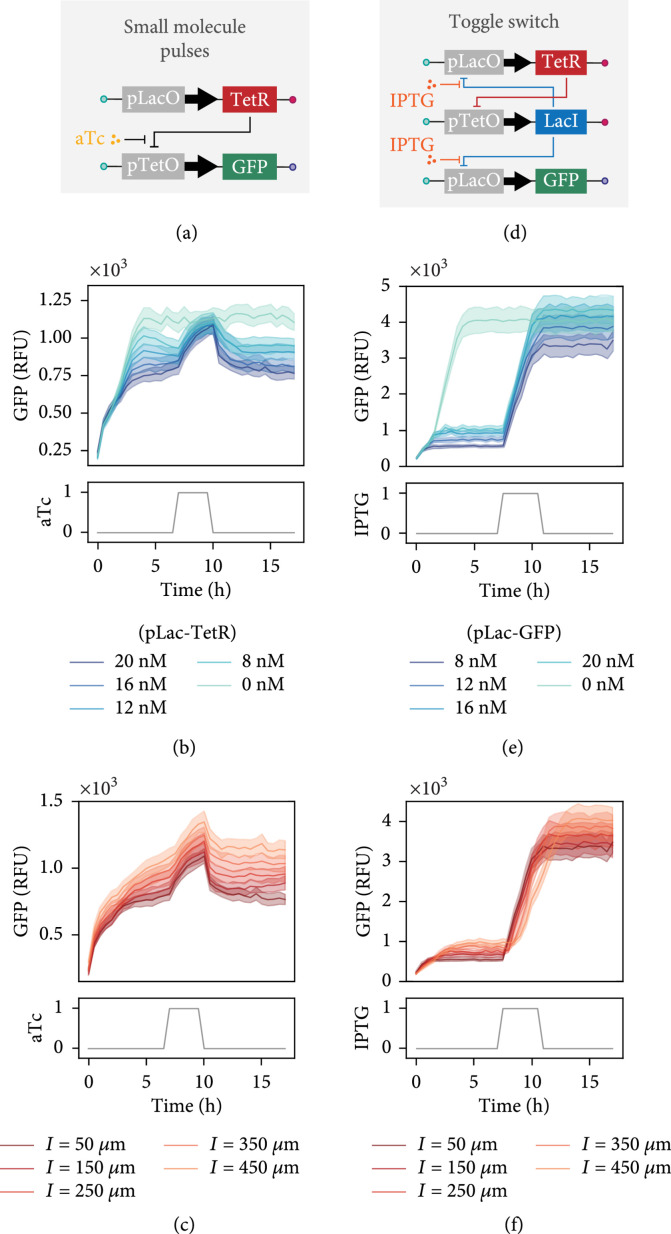
Figure 4.
Small molecule perturbations and networks. (a) Illustration of the gene elements of the aTc controllable TetR repression assay. (b) GFP expression versus time for variable concentrations of pLacO-TetR DNA template spotted inside unit cells with a connecting channel length of μm. (c) GFP expression profile over time shown for varying connecting channel lengths and a constant pLacO-TetR DNA template concentration equal to 20 nM. (d) Sketch of the toggle switch gene circuit. (e) GFP expression versus time displayed for a range of pLacO-GFP reporter concentrations spotted for unit cells with a connecting channel length of μm. The concentration of the TetR and LacI templates are kept constant, giving a range of repressor to reporter template ratios from 1 : 2 to 3 : 1. (f) Time-lapse of GFP expression shown for different connecting channel lengths and a constant pLacO-GFP reporter concentration equal to 8 nM. All data presented in (b, c, e, and f) represents mean ().

