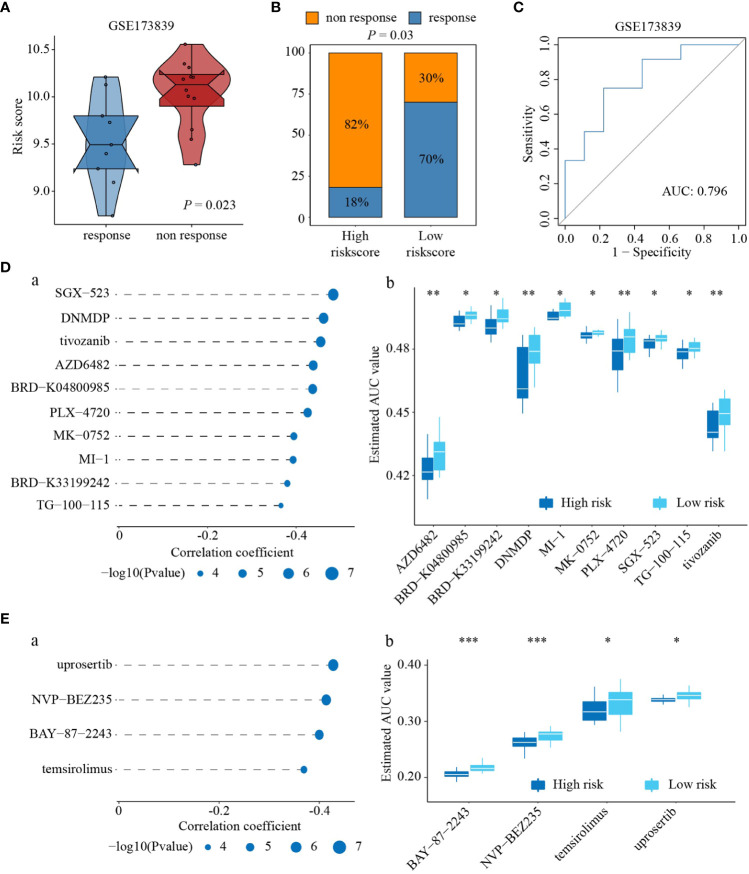
Figure 6.
Estimation of drug and immunotherapy responses. (A) Differences in risk score between response to immunotherapy and non-response to immunotherapy. (B) Differences in proportion of patients who failed to response to immunotherapy between high- and low-risk score groups. (C) AUC of risk score on predicting immunotherapy effectiveness. (D) Spearman correlation and differential response analyses of ten CRTP-derived compounds (a), and the difference of AUC value between high- and low-risk score groups response to ten CRTP-derived compounds (b). (E) Spearman correlation and differential response analyses of four PRISM-derived compounds (a), and the difference of AUC value between high- and low-risk score groups response to four PRISM-derived compounds (b). ‘*’ indicates P-value ≤ 0.05, ‘**’ indicates P-value ≤ 0.01, ‘***’ indicates P-value ≤ 0.001.

