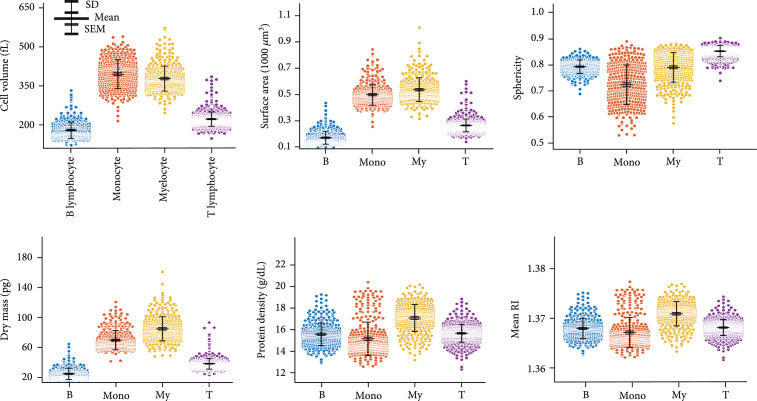
Figure 2.
Quantitative analysis of morphological (cell volume, surface area, and sphericity), biochemical (dry mass and protein density), and physical (mean RI) parameters. The protein density is directly related to the mean RI. The scatter plots represent the entire population of the measured tomograms. SD: standard deviation; SEM: standard error of the mean; B: B lymphocyte; Mono: monocyte; My: myelocyte; T: T lymphocyte.

