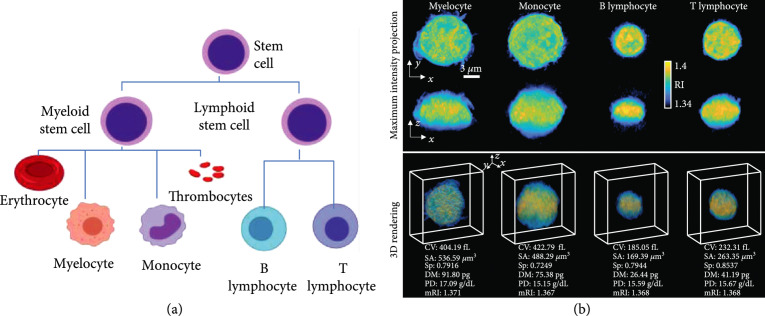
Figure 5.
WBC lineage relevant to our study and representative RI tomograms. (a) Two myeloid cells and two lymphoid cells are used to demonstrate our framework. (b) Representative RI tomograms are visualized through two different perspectives of maximum intensity projection and 3D isosurface rendering. CV: cellular volume; SA: surface area; Sp: sphericity; DM: dry mass; PD: protein density; mRI: mean RI.

