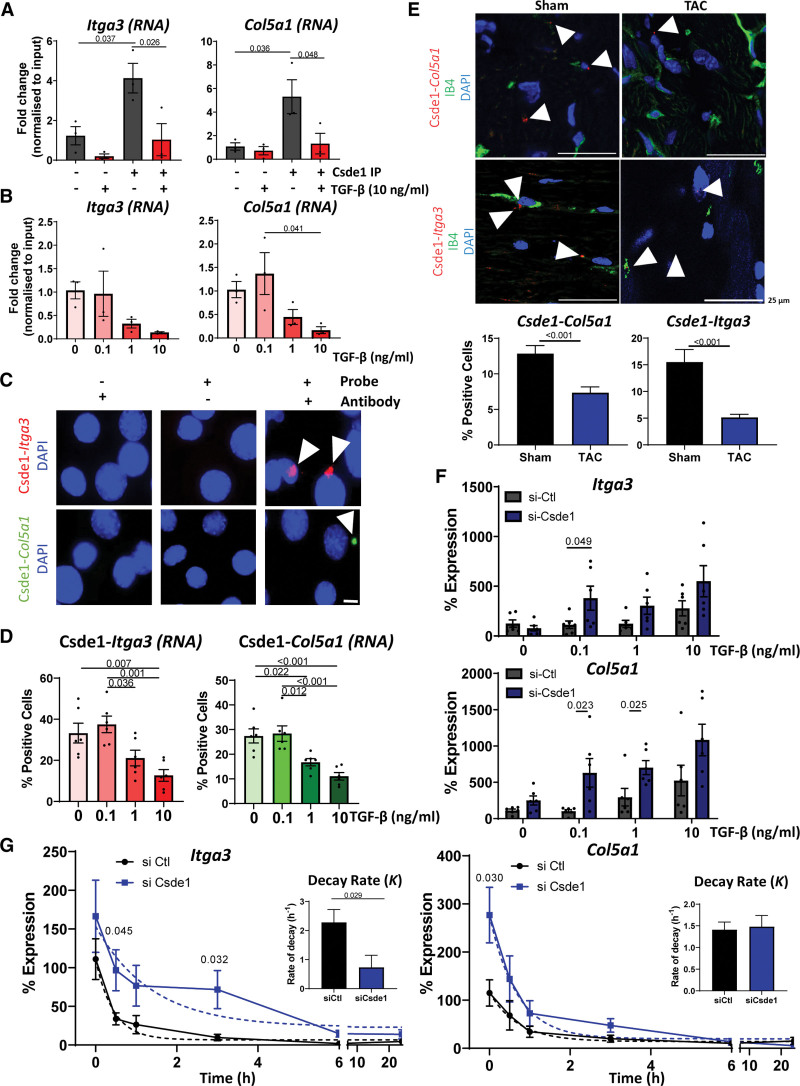
Figure 7.
Characterization of the interactions between RNA and Csde1 (cold shock domain containing E1). A, RNA immunoprecipitation (RIP) Validation of target RNAs. Quantitative polymerase chain reaction (qPCR) analysis of the enrichment of Itga3 and Col5a1RNA in Csde1 immunoprecipitation (IP) samples ± TGF (transforming growth factor)-β stimulation (10 ng/mL, 24 hours) compared with IgG controls. Normalized to input expression. n=3, data shown as average±SEM, normality tested by Shapiro-Wilk test, significance assessed by 1-way ANOVA with Tukey multiple comparison test, significance shown to 3 significant figures. B, Effects of TGF-β on target binding. qPCR analysis of Itga3 and Col5a1 abundance in Csde1 IPs in the presence of increasing concentrations of TGF-β stimulation (24 hours). Relative to input, n=3, data shown as average±SEM, normality tested by Shapiro-Wilk test, significance assessed by 1-way ANOVA with Tukey multiple comparison test, significance shown to 3 significant figures. C, Validation of interactions in situ by proximity ligation assay (PLA) assay. PLA assay in mouse cardiac endothelial cells (MCECs) showing the interaction between Csde1 and Itga3 (red) or Col5a1 (green) RNA, representative images, scale bar 10 µm. D, Effects of TGF-β on Csde1 interactions. Quantifications of changes in Csde1 interaction with Itga3 or Col5a1 RNA after stimulation with increasing concentrations of TGF-β (24 hours). Normality tested by Shapiro-Wilk test, significance assessed by 1-way ANOVA with Tukey multiple comparison test, significance shown to 3 significant figures E, Validation of interactions in vivo. PLA assay of the interaction of Csde1 with Itga3 (top) or Col5a1 (bottom; interactions red) in mouse heart sections 2 weeks following sham or transverse aortic constriction (TAC) surgery. IB4 (green) shows endothelial cells, nuclei stained with DAPI (blue). Representative images, scale bar 25 µm. Arrowheads point to positive interactions. Graphs show number of interactions normalized to the number of cells per visible field. Error data shown as average±SEM. Normality was assessed by Shapiro-Wilk test, significance was assessed by unpaired Student t test, and significance was shown to 3 significant figures. F, Effects of Csde1 on Col5a1 and Itga3 expression. qPCR analysis of the changes of expression of Itga3 and Col5a1 following TGF-β stimulation and si-Csde1 knockdown. Normalized to Gapdh, n=6, data shown as average±SEM, normality was assessed by Shapiro-Wilk test, significance assessed by unpaired Student t test between Csde1 and si-control conditions, significance shown to 3 significant figures. G, Effects of Csde1 on RNA stability. Csde1 was knocked down with siRNA for 48 hours before the addition of actinomycin D 10 µg/mL to inhibit transcription. RNA abundance was measured by real-time qPCR (normalized to Gapdh), and a nonlinear regression curve was calculated to assess effects on RNA stability. n=6, data shown as average±SEM, normality assessed by Shapiro-Wilk, and significance assessed by unpaired Student t test between corresponding conditions, significance shown to 3 significant figures. Bar charts show the averaged decay constant, K, ±SEM, of each nonlinear regression curve with significance assessed by unpaired Student t test, with significance shown to 3 significant figures. DAPI indicates 4′,6-diamidino-2-phenylindole; IB4, isolectin B4; siCsde1, Csde1 siRNA; siCtl, control siRNA; and siRNA, small interfering RNA.

