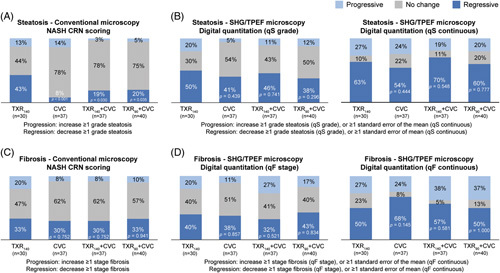
FIGURE 4.

Changes in steatosis and liver fibrosis as assessed by NASH CRN scoring and by digital quantification from baseline to week 48. (A) P/N/R analysis of steatosis changes based on the NASH CRN scoring; (B) P/N/R analysis of steatosis changes based on the digital quantitation and expressed as qSteatosis grade or qSteatosis as a continuous value; (C) P/N/R analysis of fibrosis changes based on the NASH CRN scoring; and (D) P/N/R analysis of fibrosis changes based on the digital quantitation and expressed as qFibrosis stage or qFibrosis as a continuous value. p-values obtained by comparing each treatment arm versus TXR 140 µg monotherapy using a chi-squared test. Abbreviations: CRN, Clinical Research Network; CVC, cenicriviroc; n, number of patients per group; P/N/R, Progressive/No-change/Regressive; qF, qFibrosis; qS, qSteatosis; SHG/TPEF, second harmonic generation/two-photon excitation fluorescence microscopy; TXR90, tropifexor 90 µg; TXR140, tropifexor 140 µg.
