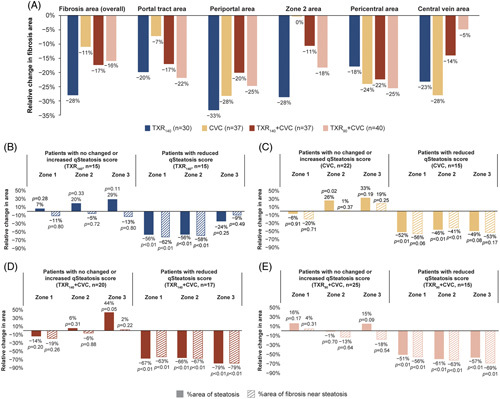
FIGURE 5.

Treatment-induced fibrosis changes in different zones of liver lobules and colocalization analysis of steatosis and fibrosis changes from baseline to week 48. (A) Digital quantification of fibrosis dynamics as a percentage change of fibrosis area in different zones of the liver lobule. The periportal and pericentral areas are set at 100 µm from the portal tract and the central vein, respectively, and the region in between is the Zone 2 area. P > 0.05 each treatment group versus TXR140 treatment group (Chi-squared test); (B–E) Colocalization analysis of steatosis and fibrosis in zone 1, 2, and 3 of liver lobules. Patients were divided into 2 subgroups: those with “unchanged” or “increased” qSteatosis and those with “reduced” qSteatosis. Wilcoxon rank test was used for p-values comparing baseline to week 48 changes. Abbreviations: CVC, cenicriviroc; n, number of patients per group; TXR90, tropifexor 90 µg; TXR140, tropifexor 140 µg.
