Figure 2.

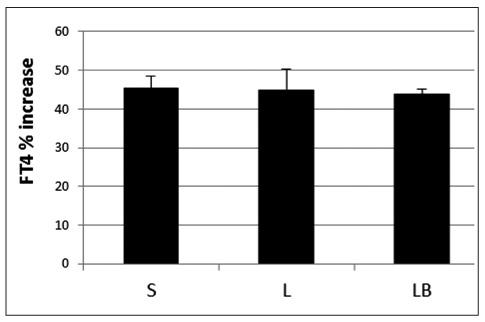
Maximum FT4 percentage (%) increase irrespective of the time-point evaluation calculated after LT4 intake in the three groups of subjects.
S, solid; L, liquid; LB, liquid at breakfast.

Maximum FT4 percentage (%) increase irrespective of the time-point evaluation calculated after LT4 intake in the three groups of subjects.
S, solid; L, liquid; LB, liquid at breakfast.