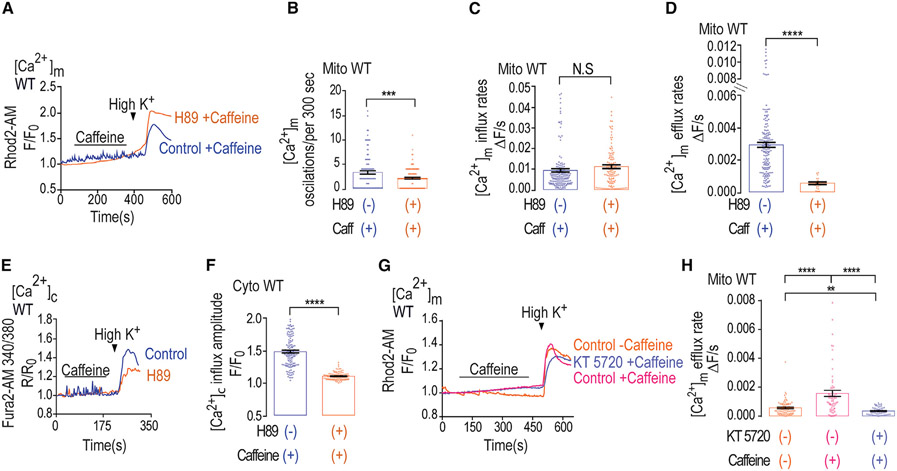
Figure 2. H89 inhibits Ca2+ efflux in WT neurons, whereas PKA inhibitor cancels caffeine effect.
(A) Representative fluorescence traces of [Ca2+]m changes monitored in control and H89 pre-treated WT primary cultured hippocampal neurons. Neurons were loaded with Rhod2-AM (1 μM) and initially superfused with caffeine, followed by Ringer’s solution containing high K+ as in Figure 1A.
(B) Quantification of [Ca2+]m oscillations shown in (A) for control (n = 105) and H89 pre-treated (n = 133) WT neurons.
(C) Quantification of [Ca2+]m influx rates shown in (A) for control (n = 164) and H89 pre-treated (n = 127) WT neurons.
(D) Quantification of [Ca2+]m efflux rates shown in (A) for control (n = 164) and H89 pre-treated WT (n = 30) neurons.
(E) Representative fluorescence traces of [Ca2+]c changes in control and H89 pre-treated WT neurons done as in Figure 1E.
(F) Quantification of [Ca2+]c influx amplitude changes during the maximum phases of the data shown in (E) for control (n = 138) and H89 pre-treated WT (n = 124) neurons.
(G) Representative fluorescence traces of [Ca2+]m changes in neurons pre-loaded with Rhod2-AM (1 μM) and initially superfused with or without caffeine (control or KT 5720 treated) as indicated, followed by Ringer’s solution containing high K+ as in Figure 1A.
(H) Quantification of [Ca2+]m efflux rates shown in (G) for control (n = 21), KT 5720- and caffeine-treated (n = 31) and caffeine-only-treated (n = 37) WT neurons.
All summary data represent mean ± SEM. **p < 0.01, ***p < 0.001 ****p < 0.0001, N.S., nonsignificant.

