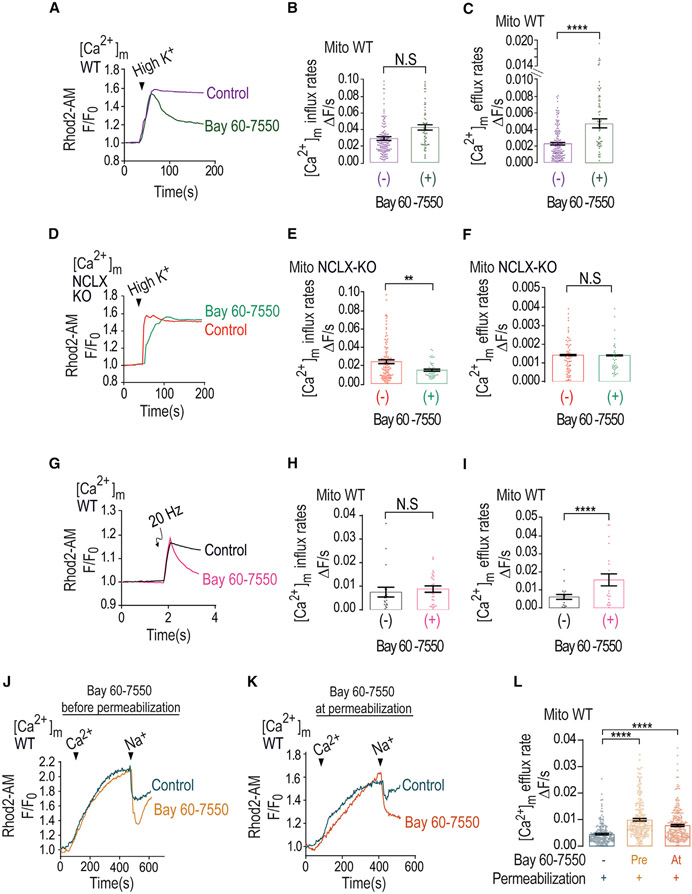
Figure 3. PDE2-selective inhibitor mimics caffeine effect by accelerating Ca2+ efflux.
(A) Representative fluorescence traces of [Ca2+]m changes monitored in control and Bay 60-7550 pre-treated WT neurons loaded with Rhod2-AM. [Ca2+]m signals were evoked only by Ringer’s solution containing high K+.
(B) Quantification of [Ca2+]m influx rates changes shown in (G) for control (n = 150) and Bay 60-7550 pre-treated (n = 60) WT neurons.
(C) Quantification of [Ca2+]m efflux rates changes shown in (G) for control (n = 155) and Bay 60-7550 pre-treated (n = 61) WT neurons.
(D) Representative fluorescence traces of [Ca2+]m changes monitored in control NCLX KO and Bay 60-7550 pre-treated NCLX KO neurons loaded with Rhod2-AM. [Ca2+]m signals were evoked only by high-K+ Ringer’s solution.
(E) Quantification of [Ca2+]m influx rates changes shown in (D) for control NCLX KO (n = 107) and Bay 60-7550 pre-treated (n = 52) NCLX KO neurons.
(F) Quantification of [Ca2+]m efflux rates changes shown in (D) for control NCLX KO (n = 90) and Bay 60-7550 pre-treated (n = 50) NCLX KO neurons.
(G) Representative fluorescence traces of [Ca2+]m changes monitored in control and Bay 60-7550 pre-treated WT neurons. Neurons were preloaded with Rhod2-AM, initially superfused with Ringer’s solution, and then electrically stimulated by 5 consecutive pulses, each of 20 Hz frequency.
(H) Quantification of [Ca2+]m influx rate changes during the maximum phases shown in (G) for control (n = 18) and Bay 60-7550 pre-treated (n = 23) WT neurons.
(I) Quantification of [Ca2+]m efflux rates shown in (G) for control (n = 19) and Bay 60-7550 pre-treated (n = 24) WT neurons.
(J) Representative Rhod2-AM fluorescent traces of [Ca2+]m changes monitored in control and Bay 60-7550 pre-treated WT neurons. Neurons were washed with recording solution followed by digitonin containing (0.002%) Ringer’s solution. To trigger [Ca2+]m influx and efflux, permeabilized neurons were treated with intracellular solution containing Ca2+ (60 μM), followed by the addition of Na+ (20 mM) (see STAR Methods).
(K) Representative fluorescent traces of [Ca2+]m changes as in Figure 3J except that Bay 60-7550 was co-added with the permeabilization buffer.
(L) Quantification [Ca2+]m efflux rates shown in (J) and (K) in control (n = 206), Bay 60-7550 pre-treated (n = 205), and Bay 60-7550-treated (n = 266) WT neurons.
All summary data represent mean ± SEM. **p < 0.01, ****p < 0.0001, N.S., nonsignificant.

