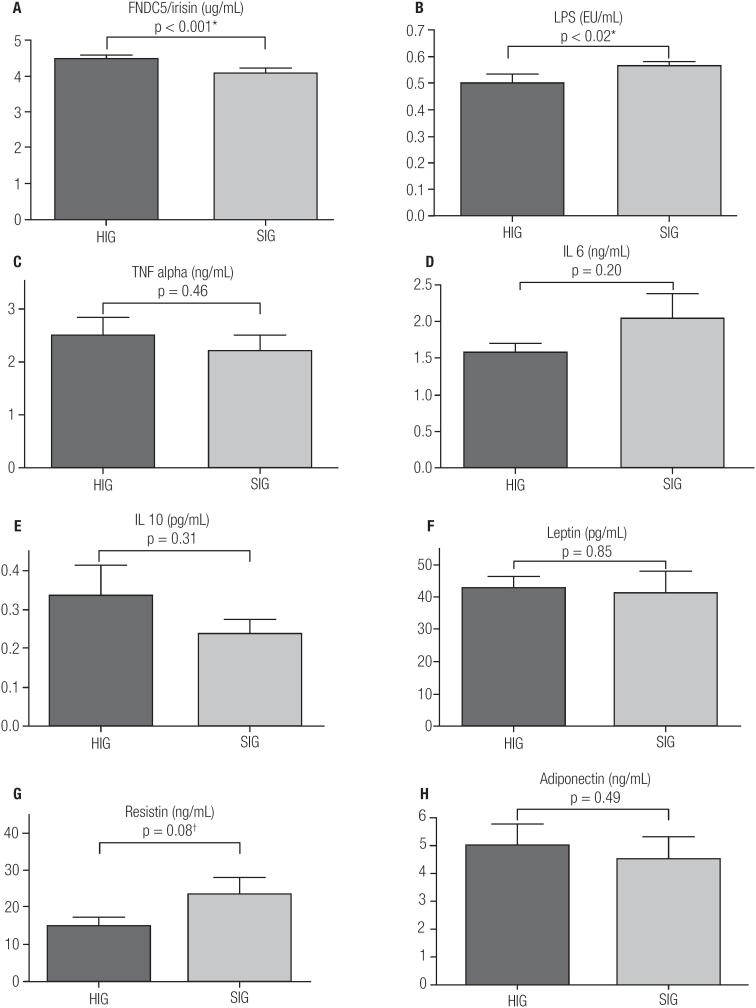
Figure 1. FNDC5/irisin levels and inflammatory markers of groups higher and smaller irisin.
HIG and SIG levels of A: FNDC5/irisin. B: LPS (lipopolysaccharide). C: TNF alpha (tumor necrosis factor alpha). D: IL6 (interleukin 6). E: IL10 (interleukin 10). F: leptin. G: Resistin. H: adiponectin. *: significant difference between HIG and SIG (p < 0.05). †: Trend difference between HIG and SIG (p between 0.051 and 0.09).

