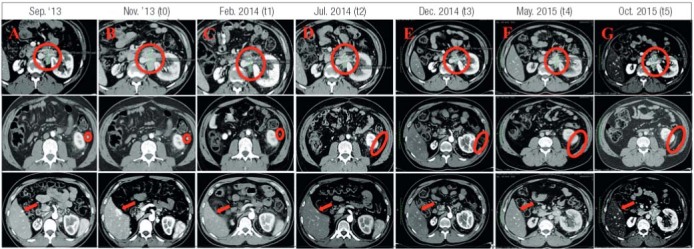
Figure 1. CT scan before sunitinib therapy: Sept. ’13 (A) and Nov.’13 (B), and during the follow up: t1 (C), t2 (D), t3 (E), t4 (F) and t5 (G). In the first line the main abdominal lesion, in the second line another abdominal lesion and in the third line liver metastases.

