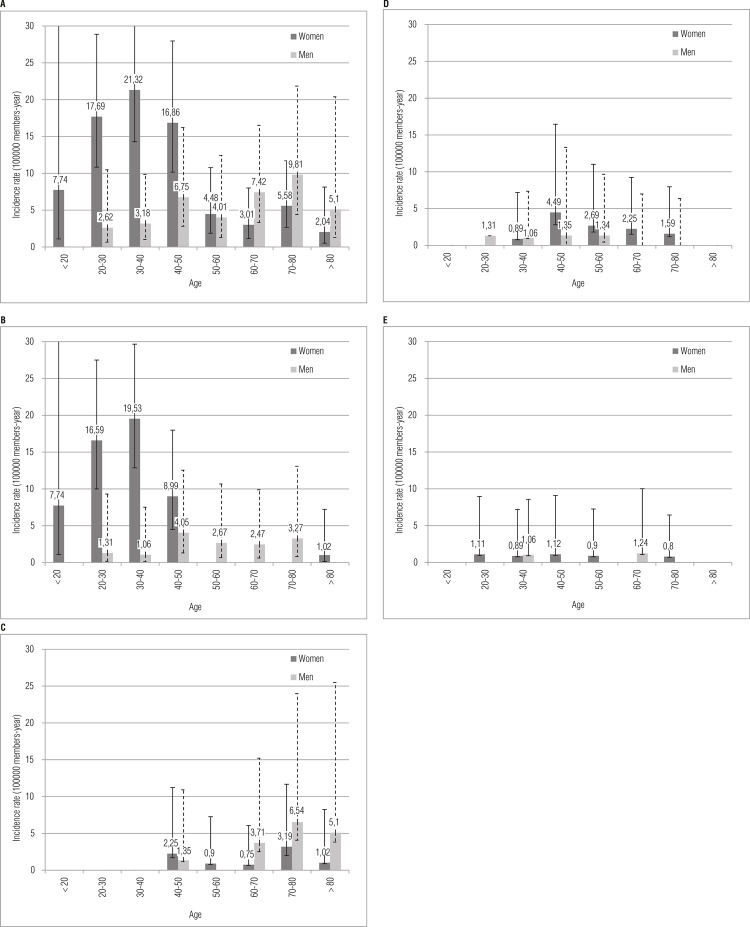
Figure 1. Overall and subtype pituitary adenomas incidence rate.
Incidence rate (IR) per 100,000 members/year according to 10 year age groups in male and females: < 20 years; ≥ 20 to < 30 years; ≥ 30 to < 40 years; ≥ 40 to < 50 years; ≥ 50 to < 60 years; ≥ 60 to < 70 years, ≥ 70 to < 80 years; ≥ 80 years.
A: All pituitary adenomas; B: Prolactinomas; C: Non-functioning adenomas; D: Acromegaly; E: Cushing disease.

