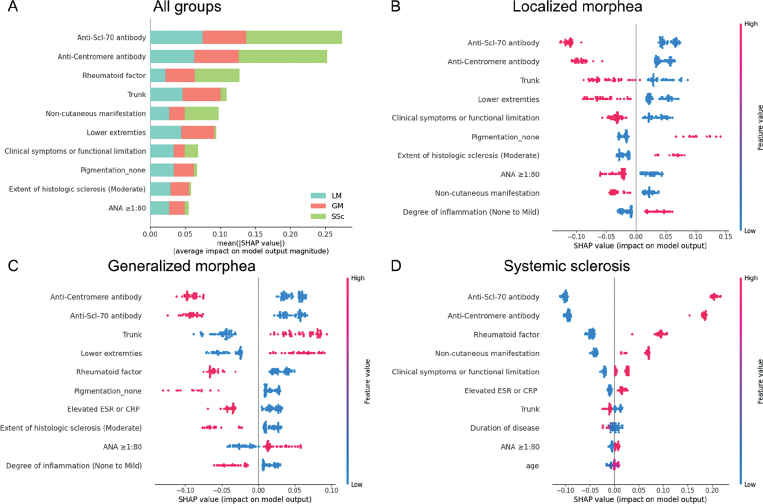
Fig. 1.
Results of the Shapley Additive Explanation (SHAP) analysis. (a) Importance ranking of the top 10 variables according to the mean absolute SHAP value (|SHAP value|), indicating the significance of each feature in the model. (b–d) SHAP summary plots for localized morphea, generalized morphea, and systemic sclerosis. Each dot represents the impact of a specific feature for a single patient. The feature value is depicted by the colour of the dot, with red indicating a higher feature value (e.g. higher levels of a particular laboratory marker or the presence of a specific symptom), and blue indicating a lower feature value (e.g. lower levels of a marker or absence of a symptom). The SHAP value on the x-axis quantifies the contribution of each feature to the model’s prediction for a particular patient. Higher SHAP values signify a stronger influence of that feature on predicting a specific disease category. The colour bar on the right-hand axes of (b–d) corresponds to the feature value, not the SHAP value. ANA: antinuclear antibody; ESR: erythrocyte sedimentation rate; CRP: C-reactive protein; Scl-70: scleroderma-70.

