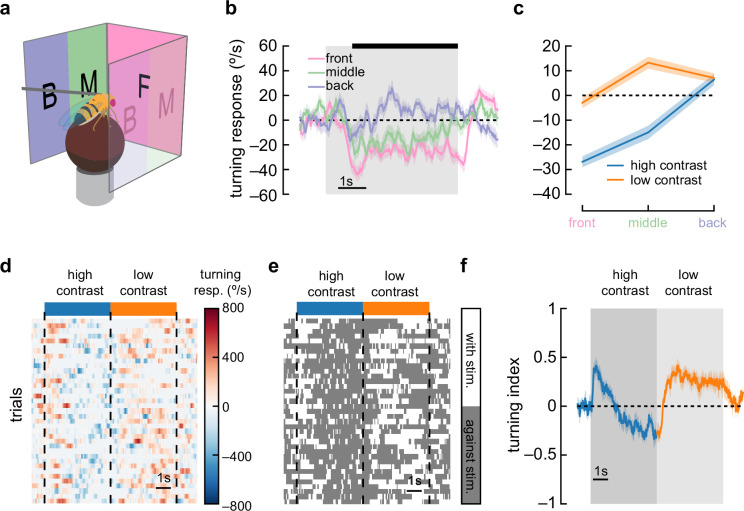
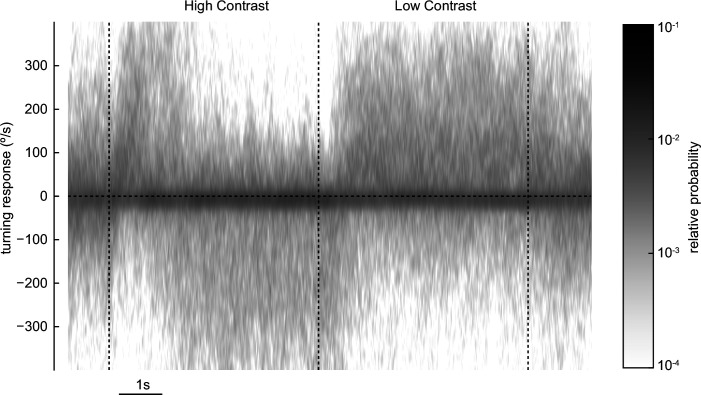
Figure 3. Anti-directional turning is driven by stimuli in the forward-facing visual field and is not driven by saccades.
(a) We divided our panoramic display into three sections: the front 90°, the 45° behind the fly on either side, and a middle 45°. (b) High-contrast sinusoidal gratings were presented on each of these three display sections, with the remaining sections blank. Flies turned syn-directionally when stimuli were presented behind the fly, and turned anti-directionally when stimuli were presented in front of the fly. Shaded patches represent ±1 SEM. N=55 flies. (c) Average turning in the last 4 s of the stimulus (black bar in b), in low-contrast and high-contrast conditions. Shaded patches in the time trace plots represent ±1 SEM. N=55 flies. (d) A single fly responds to many trials of sinusoidal grating stimuli at high contrast (blue bar) and low contrast (orange bar). We show a heatmap of the fly’s responses over time (horizontal axis) and across trials (vertical axis). (e) We can ignore the magnitude of the turning and instead only quantify whether the fly was turning in the same direction as the stimulus (white area) or in the opposite direction (dark gray area). This shows sustained anti-directional turning, not brief saccades. (f) Averaging the direction (but not magnitude) of turning across trials and across flies yields a turning index for each point in time. Shaded patches in the time trace plots represent ±1 SEM. N=7 flies.


