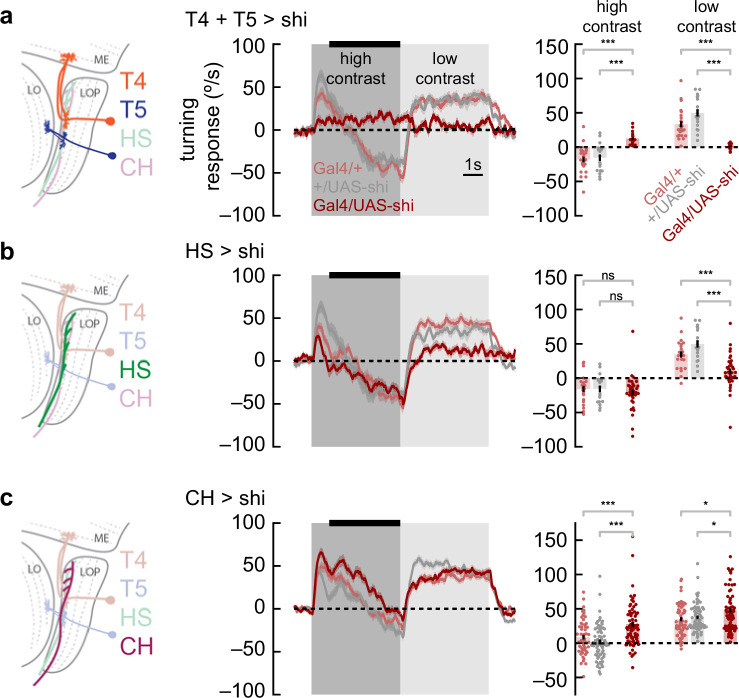
Figure 4. Syn-directional and anti-directional turning share common circuitry.
(a) We silenced T4 and T5 neurons by expressing shibirets selectively in those neurons. We measured turning behavior during a contrast-switching stimulus (as in Figure 2c). Results from flies with T4 and T5 silenced shown in dark red, while controls are in light red and gray. Average fly behavior during the last 4 s of the first contrast (black bar on left) shown as bars on the right, with individual fly behavior shown as dots. Note that the data labeled ‘low contrast’ are from experiments in which the low-contrast stimulus was shown before the high-contrast stimulus. Shaded patches in the time trace plots represent ±1 SEM, as do vertical lines on bar plots. *** indicates experimental results are significantly different from results, p<0.001 via a two-sample Student’s t-test. * indicates p<0.05. N=17, 24, 19 flies with genotypes T4T5/Shibirets, T4T5/+, +/Shibirets. (b) Results from horizontal system (HS) neuron silencing as in (a). Silencing HS neurons reduced syn-directional turning behavior (p<0.001) but did not have a strong effect on anti-directional turning. N=34, 21, 19 flies with genotypes HS/Shibirets, HS/+, +/Shibirets. (c) Results from CH neuron silencing as in (a). CH neuron silencing reduced the degree of anti-directional turning (p<0.001). N=63, 57, 70 flies with genotypes CH/Shibirets, CH/+, +/Shibirets.

