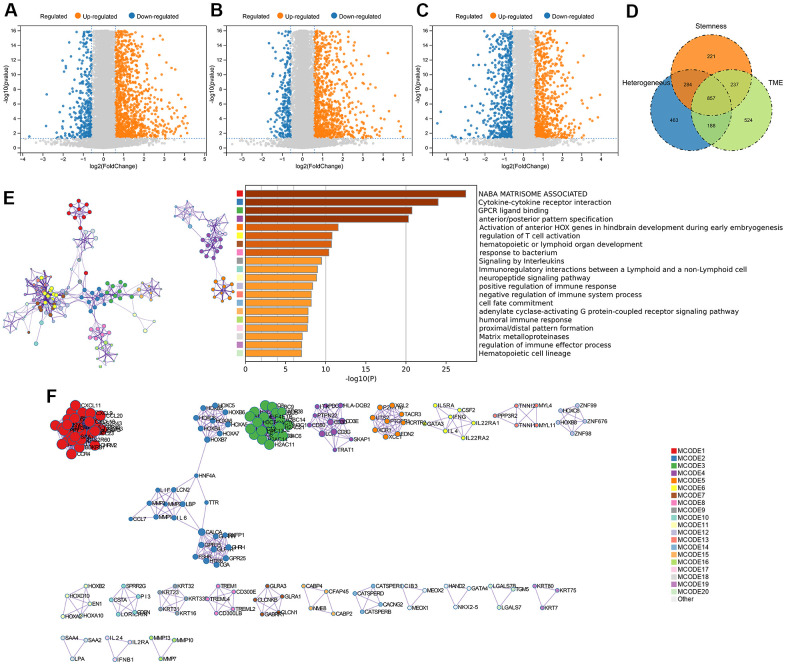
Figure 2.
DEGs screening and enrichment analysis. (A) Differentially expressed genes (Fold change >1.5 and P < 0.05) were screened between different clusters distinguished in genomic heterogeneity, (B) stemness, and (C) tumor microenvironment, respectively. (D) Venn diagram showing the overlap of identified differentially expressed genes. (E) Enrichment analysis of the differentially expressed genes. (F) Protein-Protein Interaction Networks, PPI.

