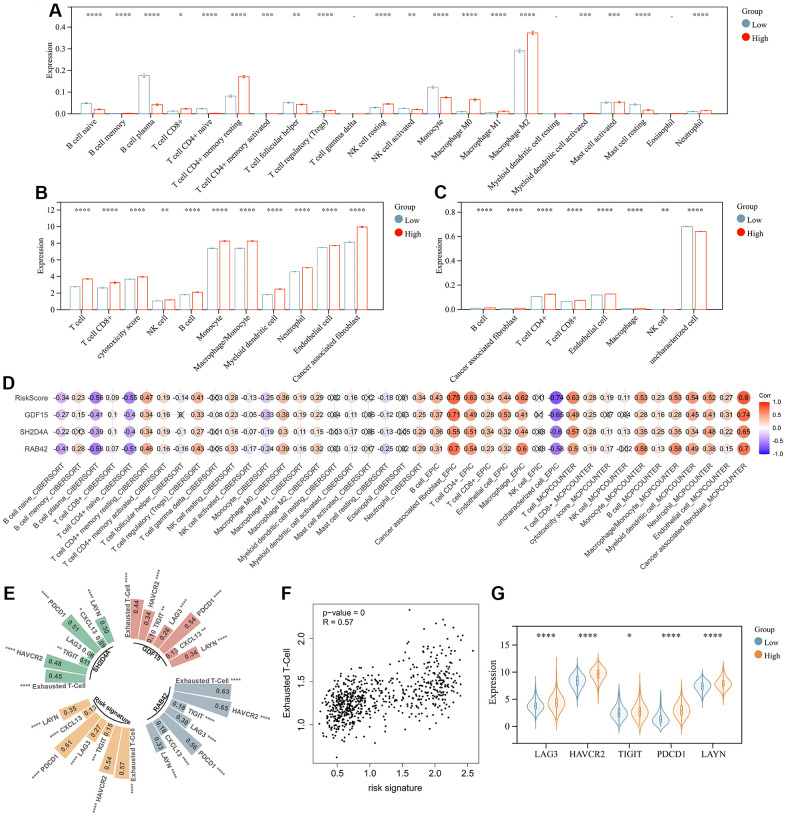
Figure 8.
Risk signature is associated with infiltrating immune cells. (A) The level of immune cell infiltration between different risk subgroups evaluated by CIBERSORT, (B) MCPCOUNTER and (C) EPIC algorithm, respectively. (D) Correlation of infiltrating immune cells with risk scores and 3 risk hub genes. (E, F) Correlation of exhausted T cell signature with risk scores and 3 risk hub genes. (G) Violin plot showing the expression levels of the exhausted markers between low- and high-risk groups in the TCGA dataset. *, P < 0.05; **, P < 0.01; ***, P < 0.001; ****, P < 0.0001.

