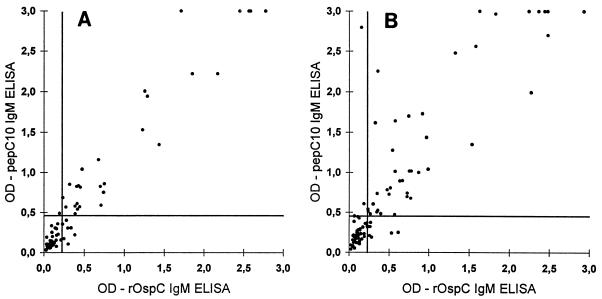
FIG. 2.
Correlation of IgM anti-pepC10 and anti-rOspC measurement in sera from 80 patients with EM (A) and 100 patients with NB (B). The horizontal lines represent the cutoff of the IgM rOspC ELISA, and the vertical lines represents the cutoff of the IgM pepC10 ELISA. The pepC10 ELISA significantly improved the quantitative discrimination between control and seropositive samples, as estimated by comparing the distances of the achieved OD values from the cutoff level in each test by Wilcoxon’s rank sum test for paired data. In panel B, the sum of the negative ranks is 1,296 (P < 0.008).

