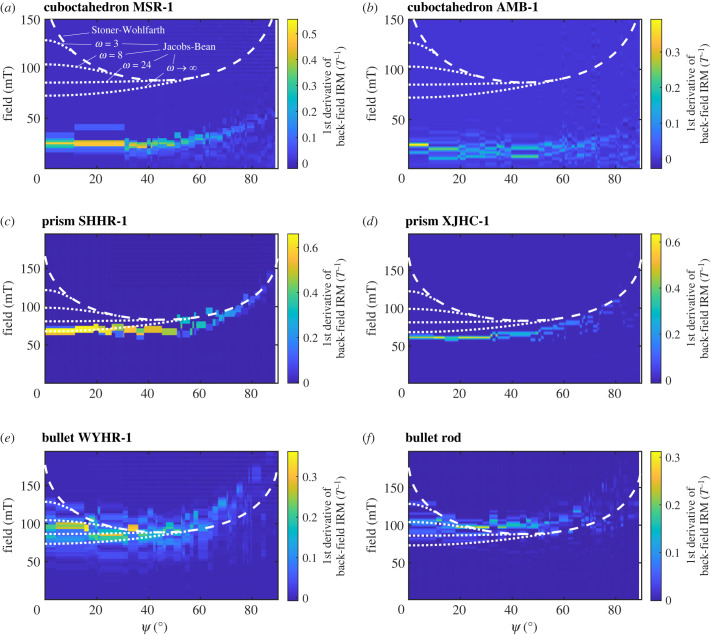
Figure 4.
Switching field distribution from the first derivative of back-field isothermal remanent magnetization (IRM) curves for all intact chain models. Ψ is the angle between the applied field and the chain axis. Dashed lines and dotted lines are calculated from the Stoner–Wohlfarth model [38] and the Jacobs–Bean model [39,40] with varying ω (the ratio of saturation magnetization to magnetocrystalline anisotropy field) [40], respectively. Colour bars indicate the first derivative values of normalized back-field IRM for applied magnetic fields.

