Figure 3.

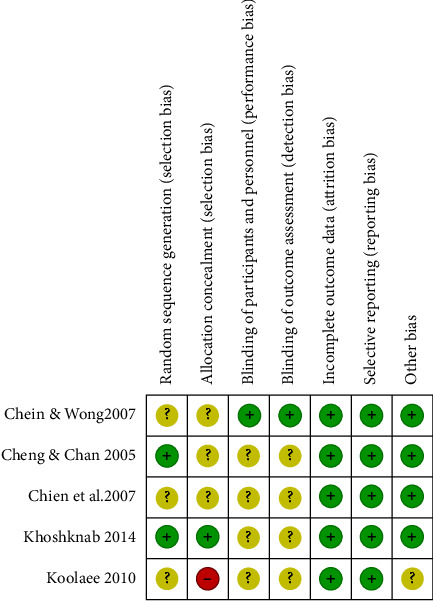
Risk of bias summary using cochrane risk of bias tool [33].  Yellow indicates unclear.
  Green indicates low risk.
  Red indicates high risk.

Risk of bias summary using cochrane risk of bias tool [33].  Yellow indicates unclear.
  Green indicates low risk.
  Red indicates high risk.