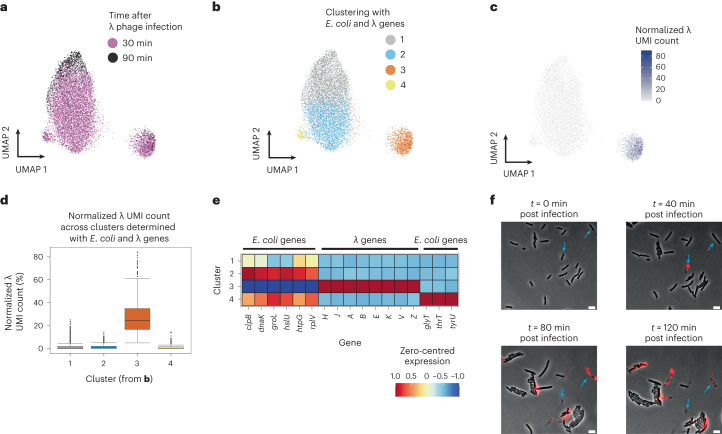
Fig. 5. M3-seq reveals limited host response to heterogeneous λ phage infection.
a, UMAP of λ phage-infected cells generated using alignments to both E. coli MG1655 and λ phage genomes (‘combined genome’). Colours indicate sampling timepoint after infection. b, Same as a but with colours indicating clusters of transcriptionally similar cells. c, Same as a but with colour gradient indicating normalized λ phage UMI count in each cell. Cluster 3 from b is strongly enriched for λ transcripts. We refer to this group of cells as the ‘lytic cluster’. d, Boxplots of normalized λ UMI count across each cluster in b (n = 4,326, 3,697, 1,189, 172). Boxplot limits are as defined in Methods. e, Zero-centred and normalized expression of marker genes for each of 4 clusters identified in b. Marker genes were identified as described in Methods. f, Representative composite time-lapse images of E. coli MG1655 infected with λ phage at MOI = 100. The red channel is a propidium iodide stain indicating cell death. Of cells in the initial frame, 34.1% were lysed. Data were collected from a single set of acquired images (N = 1,300 cells). Scale bar, 5 μm.

