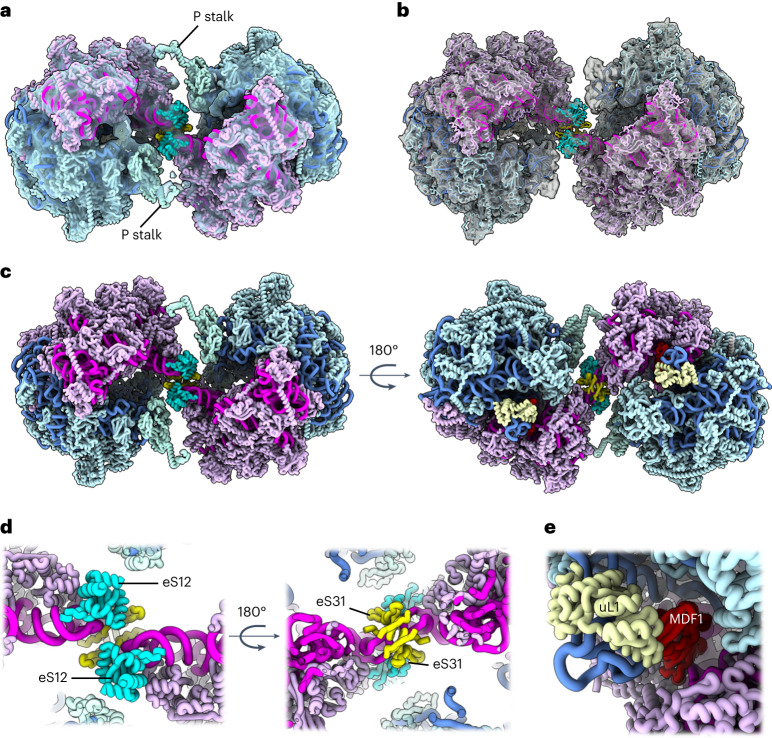
Fig. 3. Map and model of the hibernating ribosome dimer from S. lophii.
a, The ribosome dimer map at 14.3 Å resolution determined by subtomogram averaging (transparent grey) with atomic model of the dimer fitted (licorice representation). b, Two individual half-dimer maps at 10.8 Å resolution (transparent grey) superimposed with the dimer map (from a) and the atomic model fitted. Note that the P stalks are better defined in a, while the map has more detail in b. c, Two views of the atomic model of the dimer shown without the map and rotated by 180°. LSU rRNA, blue; LSU protein, light blue; SSU rRNA, magenta; SSU protein, light pink; L1 protein, cream. d, Two close-ups of the dimer interface, rotated by 180°. The dimer interface appears to be established by the subunits eS12 (cyan) and eS31 (yellow). e, Close-up of the E site. uL1, cream; MDF1, red.

