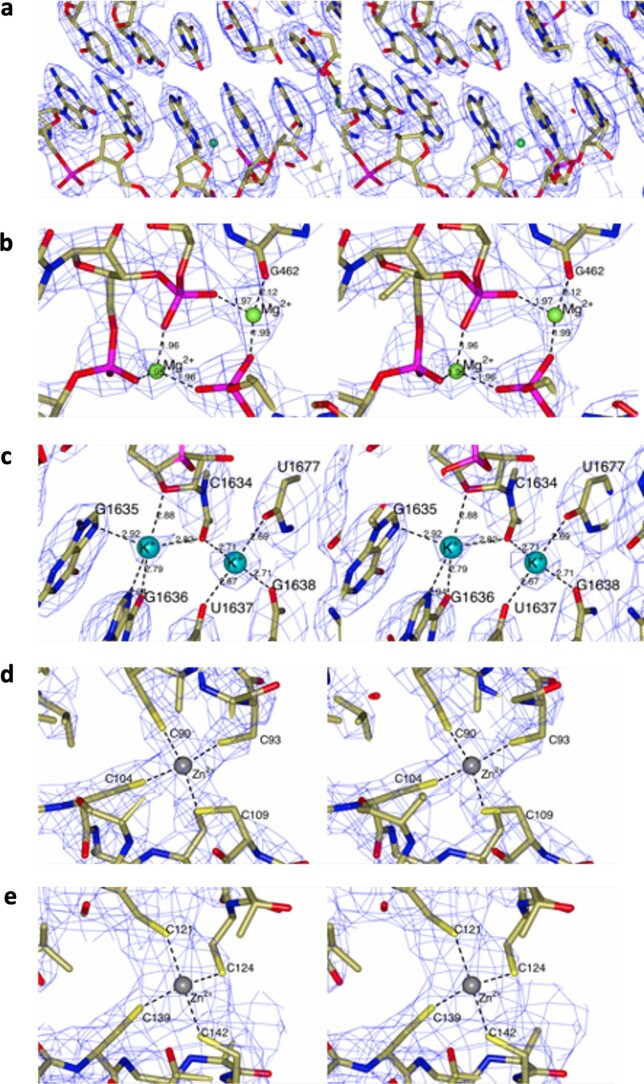
Extended Data Fig. 4. Representative close-ups of the cryoEM density.
Stereograms showing sections of the cryo-EM density for regions of the whole-ribosome map (a-d) and SSU head map (e). a Representative section in the vicinity of G146 within the L50 rRNA clearly shows the difference between adenine and guanine bases. b Density peaks are modelled as Mg2+ ions on the basis of short (2.0 - 2.1 Å) coordinating distances to oxygen ligands. c K+ ions are assigned on the basis of longer coordinating distances (2.6 - 2.9 Å) which may include nitrogen ligands. d-e Zn2+ ions modelled in eL40 and eS31 chains.

