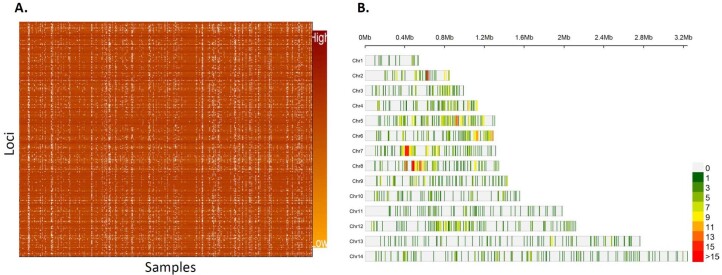
Extended Data Fig. 4. Successfully sequenced samples across three regions in Ethiopia and retained genome wide loci.
A) Heatmap color shows samples (n = 609, columns) and loci (n = 1395, rows) coverage retained after filtering (Extended Data Fig. 3) for downstream analysis. B) Distribution of retained SNPs across Plasmodium falciparum chromosomes. The plot shows distribution of 1395 retained high quality biallelic SNPs across the 14 P. falciparum chromosomes within 0.025 Mb window size. Color coded from light grey for masked regions with no SNPs to red for regions containing high number SNPs per chromosome.

