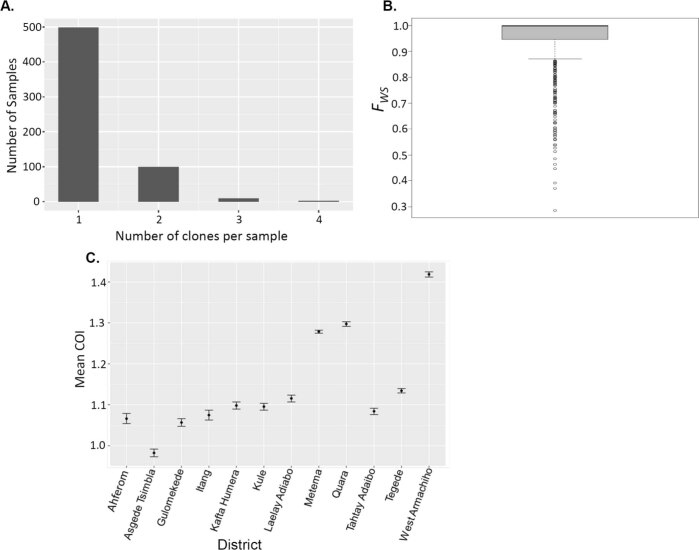
Extended Data Fig. 5. Complexity of infections.
A) Distribution Number of clones per sample across all genotyped samples (n = 609) showing most of isolates carrying one clone (COI = 1). B) Cumulative within-infection FWS fixation showing majority of isolates classified as monogenomic (FWS > 0.95). Number of clones per sample. C) Spatial heterogeneity of mean complexity of infections per district across three regions in Ethiopia. Vertical lines show 95% confidence intervals. Samples size per district ranges 9–167 (see supplementary table 1).

