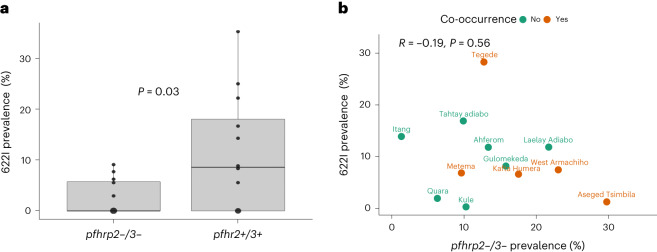
Fig. 3. K13 622I mutation among pfhrp2/3-deleted and non-deleted parasite populations.
a, Comparison of mean K13 622I mutation prevalence (P = 0.03, unpaired Student’s t-test, two-tailed) between pfhrp2/3 double (n = 119) and pfhrp2/3 non-deleted (n = 223) parasite populations by district across three regions in Ethiopia. b, Relationship between pfhrp2/3 double-deleted parasite prevalence and K13 622I mutation prevalence by district. Prevalence estimates are weighted (see Supplementary Table 2). Orange points represent districts where parasites harbouring both pfhrp2/3 deletions and K13 622I mutations are observed. The boxplot centre lines in a show the median value, the upper and lower bounds show the 25th and 75th quantiles, respectively, and the upper and lower whiskers show the largest and smallest values, respectively.

