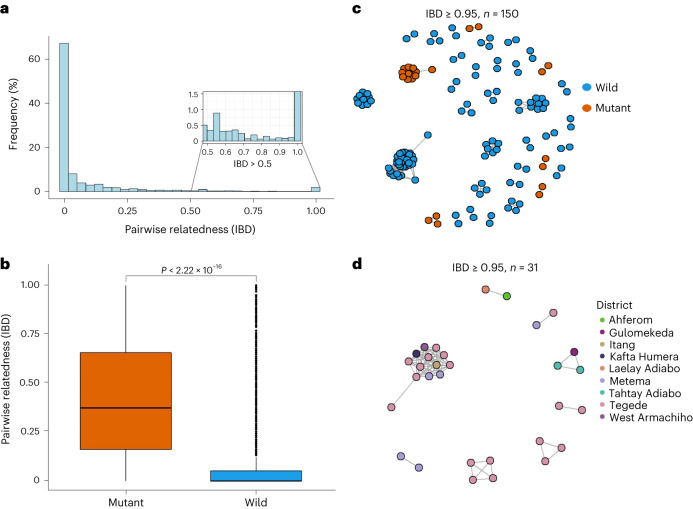
Fig. 5. Pairwise IBD sharing and relatedness networks suggest clonal transmission and expansion of K13 622I parasites.
a, Pairwise IBD sharing across all three regions of Ethiopia. The plot shows the probability that any two isolates are identical by descent, where the x axis indicates IBD values ranging 0–1 and the y axis indicates the frequency (%) of isolates sharing IBD. The inset highlights highly related parasite pairs from out of total pairs (n = 44,883), with a heavy tail in the distribution and some highly related pairs of samples having IBD ≥ 0.95. b, Pairwise IBD sharing within parasites carrying K13 622I vs wild type (P < 0.001, two-tailed, Mann–Whitney U-test). Boxes indicate the interquartile range, the line indicates the median, the whiskers show the 95% confidence intervals and black dots show outlier values. P value determined using Mann–Whitney test is shown. c, Relatedness network of highly related parasite pairs (n = 150) sharing IBD ≥ 0.95. Colours correspond to K13 622I mutant and wild parasites. d, Relatedness network of only K13 622I parasite pairs (n = 31) sharing IBD ≥ 0.95 at the district level/local scale. Colours correspond to districts across three regions in Ethiopia. In both c and d, each node identifies a unique isolate and an edge is drawn between two isolates if they share their genome above IBD ≥ 0.95. Isolates that do not share IBD ≥ 0.95 of their genome with any other isolates are not shown.

