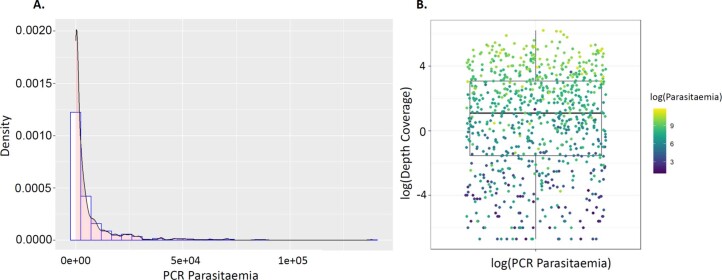
Extended Data Fig. 2. PCR parasitemia distribution and association between sequencing coverage and parasitaemia.
A) Density plot showing parasitemia distribution with median parasitemia = 1411 parasite/ul for all successfully sequenced samples (n = 609). B) Association between sequencing coverage and parasitaemia. The MIP sequencing success is parasitaemia dependent as shown in the heatmap color. n represents the number of samples used in each panel. The boxplot centre lines in B, show the median value, the upper and lower bounds show the 25th and 75th quantiles, respectively, and the upper and lower whiskers show the largest and smallest values, respectively.

