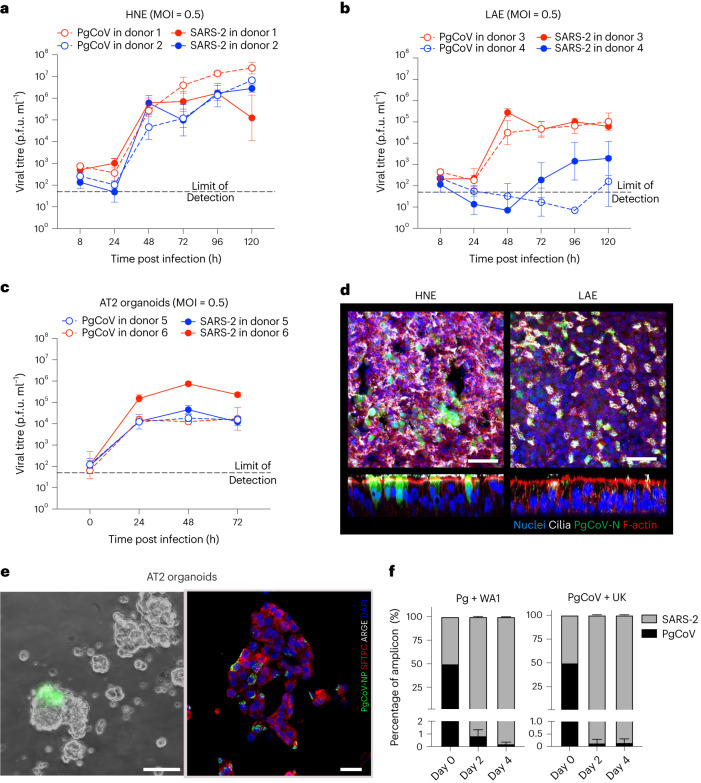
Fig. 3. Susceptibility, adaptation and fitness of PgCoV in human respiratory cells.
a–c, Comparison of PgCoV-WT and SARS-CoV-2 (WA1) growth in primary HNE cells (a), LAE cells (b) and AT2 organoids (c). The growth curve values were measured in triplicate for each timepoint, data are mean ± s.d. d, Immunofluorescence co-staining of PgCoV-WT antigens in representative HNE and LAE cultures at 72 h post infection. Scale bar, 50 μm. e, Live image of PgCoV-GFP virus-infected AT2 organoids at 48 h (left; scale bar, 40 μm) and immunofluorescence co-staining (right; scale bar, 25 μm) of PgCoV-WT (green) with SFTPC (red) and AGER (white) on infected AT2 organoids fixed at 72 h. f, Percentage of NTD coding sequences in RNA samples collected from PgCoV and SARS-CoV-2 competition experiments, n = 3 samples per timepoint, data are mean ± s.d.

