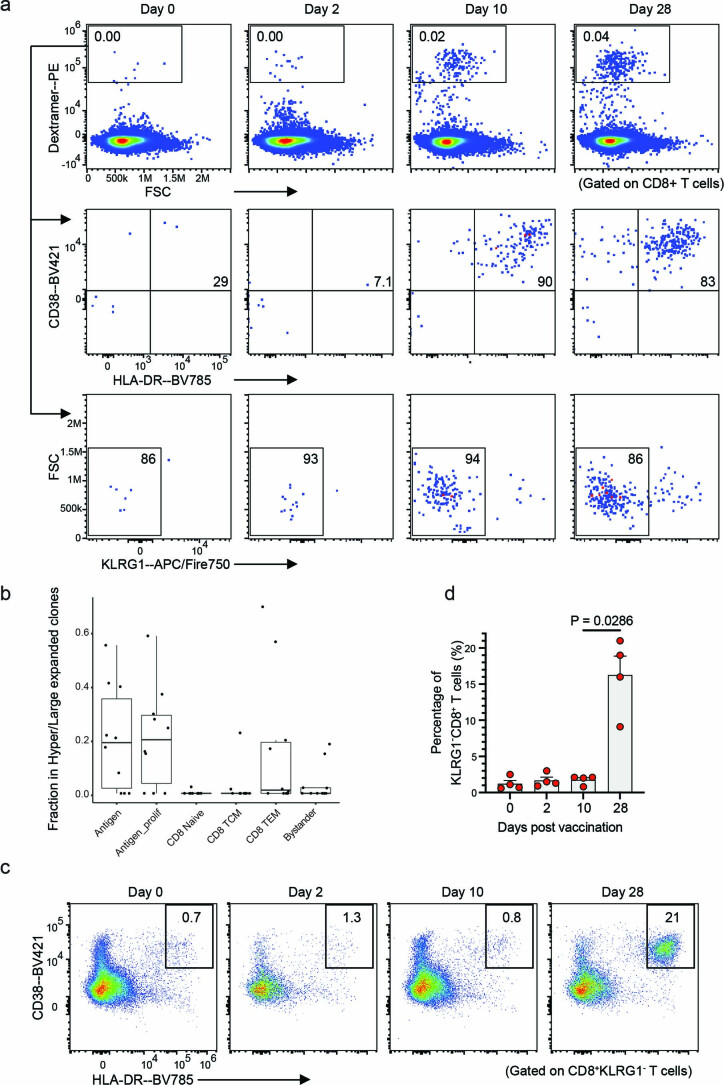
Extended Data Fig. 7. Flow cytometry evaluation of Dex+CD8+ T Cells.
a, Flow cytometry data generated during validation of individual dextramer reagents, with the progressive emergence of cells in the Dex+ gate across timepoints for a single donor. CD8+ cells were used as input. Middle and bottom row show CD38, HLA-DR, and KLRG1 abundance from the parent gate of Dex+CD8+ T cells. b, Boxplots indicate the fraction of cells harboring a hyper- or large-expanded TCR clone in each cluster across n = 10 samples. Each dot represents one biological sample. Box center lines, bounds of boxes and whiskers indicate median, first and third quartiles and minima and maxima within a 1.5× interquartile range (IQR), respectively. c, Exemplary flow cytometry plots indicate the percentage of cells in CD38+HLA-DR+ gate of a single donor, from a parent gate of KLRG1−CD8+ cells. d, Bar graph shows the percentage of CD38+HLA-DR+ cells in each donor, as a fraction of the KLRG1−CD8+ gate exemplified in c. Data represents n = 4 donors with variable HLA haplotypes, presented as mean ± s.e.m.; p-value is calculated using unpaired Mann-Whitney U test. PE, phycoerythrin.

