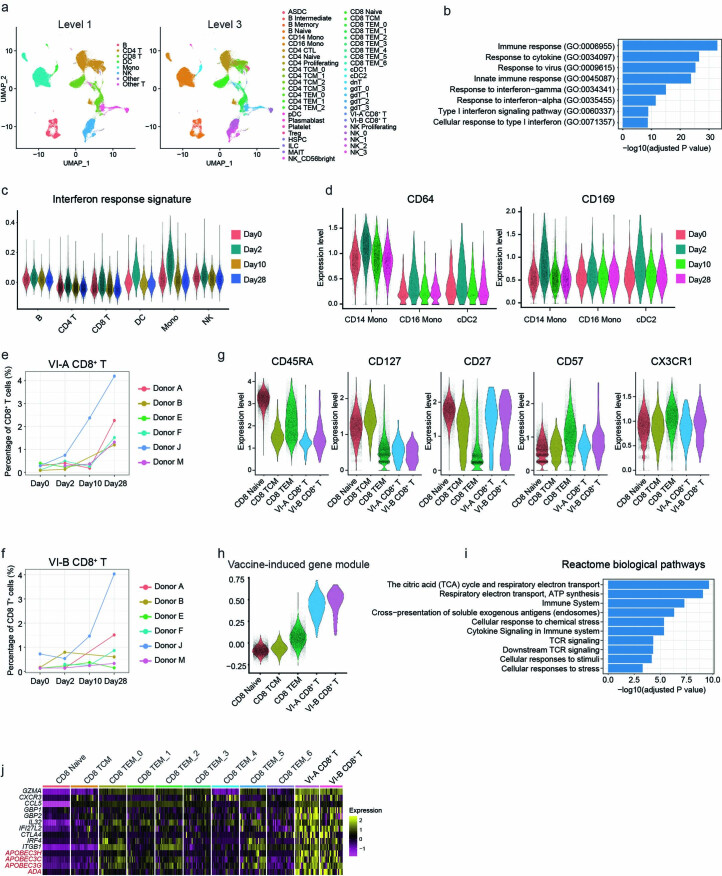
Extended Data Fig. 2. Unveiling unique molecular signatures of vaccine-induced CD8+ T cells via CITE-seq analysis.
a, UMAP visualizations of 113,897 single cells profiled with CITE-seq and clustered on the weighted combination of both RNA and protein modalities. Cells are colored with either level 1 or level 3 annotations. b, Enriched GO terms for activated (Day 2 vs Day 0) genes in CD14+ Monocytes. c, Violin plots of interferon response signatures in selected cell types across four timepoints. P values were adjusted for multiple testing correction. d, Violin plots of protein expression of CD64 and CD169 in single cells in selected cell types, across four timepoints. e-f, Percentage of CD8+ T cells in vaccine-induced groups for each donor across four timepoints. g, Violin plots showing the protein expression of CD45RA, CD127, CD27, CD57 and CXC3R1 in selected cell types. h, Violin plots comparing gene module scores in VI-A and VI-B CD8+ T cells, as well as selected other subsets. i, Enriched reactome biological pathways for the 197 signature vaccine-induced gene set. P values were adjusted for multiple testing correction. j, Heatmap showing the expression of select genes in CD8+ T cell subtypes. The visualization presents pseudobulk averages, with cells grouped by cell type, individual human donor, and timepoints, and demonstrates that marker genes are reproducible across donors.

