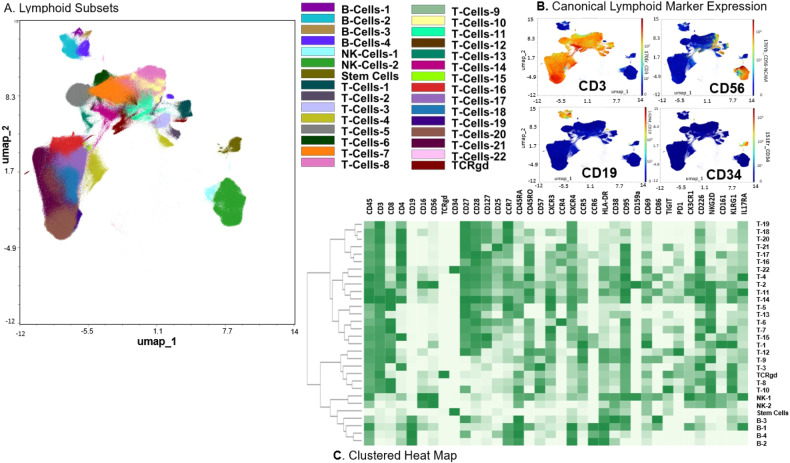
Fig. 1. Lymphoid Subsets.
A Phenograph Clusters projected on UMAP plot of all identified lymphoid subsets (NK, T, and B cells) and CD34+ cells using the lymphoid panel. Myeloid or lineage negative subsets were excluded for clarity. B Canonical marker expression (CD3, CD19, CD56, CD34) of major lineages. C Clustered heatmap showing the expression of all markers (lymphoid panel) expressed in identified lymphoid subsets across all files.

