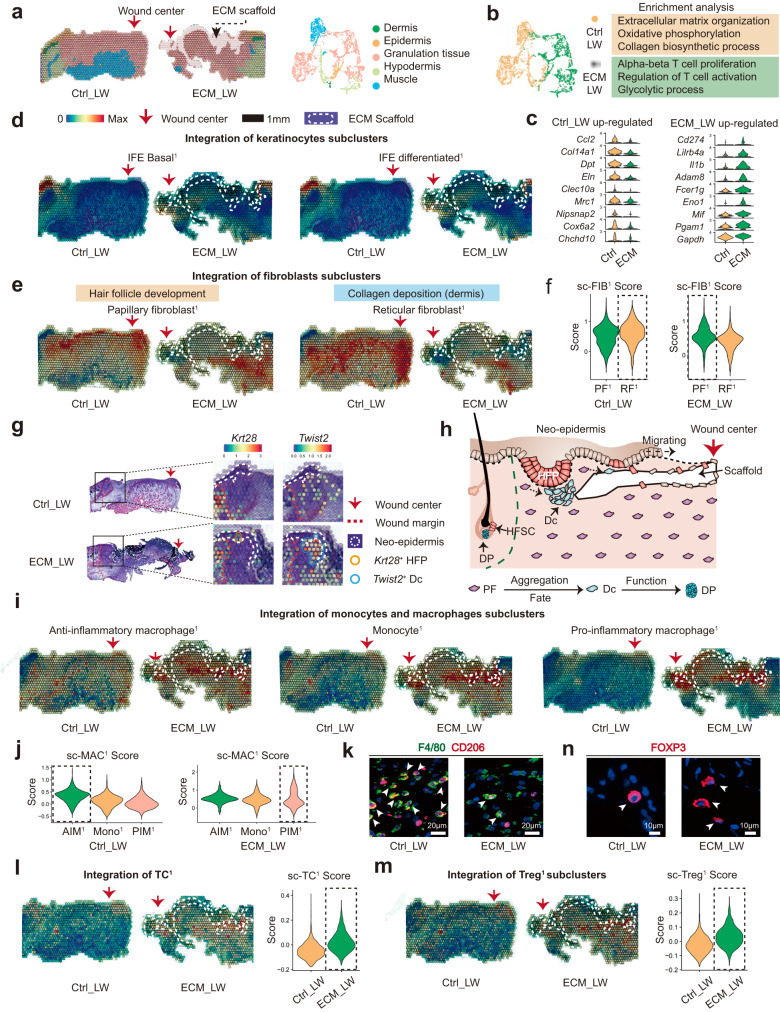
Fig. 3. Spatial anchors tracing the cell distribution around the ECM scaffold.
a The unsupervised clustering indicated the anatomical structure of samples. b Gene enrichment analysis between ECM_LW and Ctrl_LW group. c Violin plot showing the up-regulated genes of Ctrl_LW and ECM_LW samples of ST profile. d Spatial feature plot showing the distribution of IFEB1 and IFED1 subclusters in tissue sections. e Spatial feature plot showing the distribution of PF1 and RF1 subclusters in tissue sections. f Violin plots of FIB scores of individual spots derived from scRNA-seq data (sc-FIB score) for each subcluster. Dotted boxes stressed clusters with the higher average sc-FIB scores. g The spatial feature plot highlighted the expression of Krt28+ hair follicle progenitor and Twist2+ dermal condensate in migrating neo-epidermis. h Illustration showing the epithelialization along with de novo HF formation in the biomaterials-mediated healing process. i Spatial feature plot showing the distribution of MAC subclusters in tissue sections. j Violin plots of MAC scores of individual spots derived from scRNA-seq data (sc-MAC score) for each subcluster. Dotted boxes stressed clusters with the highest average sc-MAC score. k Representative IF images of stained AIM1 (F4/80+CD206+), white arrowheads showing the F4/80+CD206+ cells.l Spatial feature plot and violin plot showing TC1 distribution and expression level in tissue sections. m Spatial feature plot and violin plot showing the distribution and expression level of Treg1 in tissue sections. n Representative IF images of stained Treg1 (FOXP3), white arrowheads showing the FOXP3+ cells.

