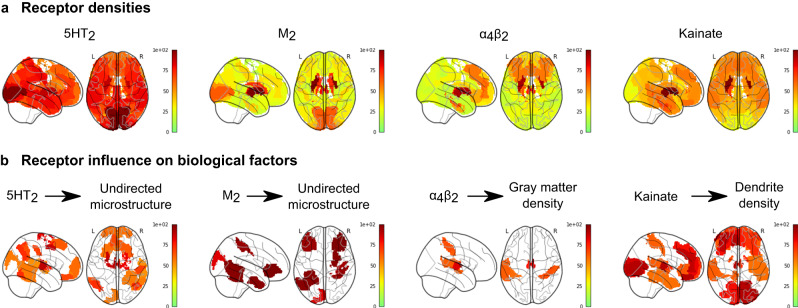
Fig. 7. Model-derived maps of receptor influence on PD neurodegeneration.
We compared the (a) receptor densities and (b) influence maps. Influence maps show the brain regions where specific receptors are consistently informative to explaining the neuropathological changes across all PD subjects, and are re-scaled to arbitrary units for visualization. They represent the population-wide improvement in model residuals at each region due to the inclusion of receptor density maps and receptor-pathology interactions as model predictors for each PD patient. Receptor influences are calculated as the Wilcoxon rank-sum statistics of each model’s residuals for a region, and the maps show only regions with significant z-scores (P < 0.05) of Wilcoxon rank-sum statistics relative to the null distributions.

