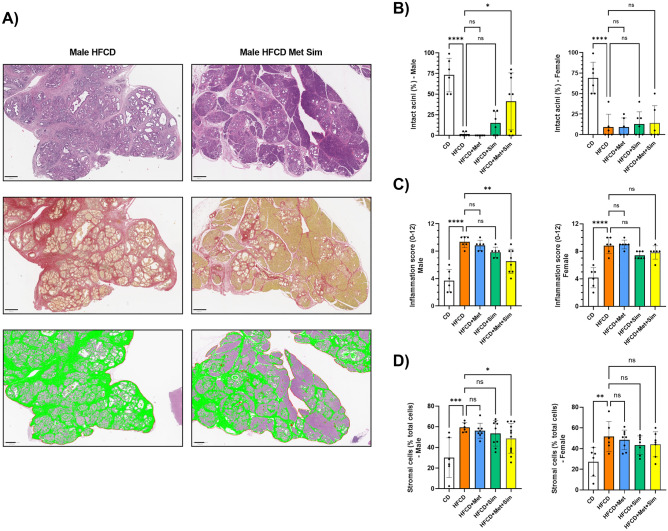
Figure 2.
(A) Representative microscopic images of the pancreas of male KC mice fed the high fat, high calorie diet (HFCD) (left column) or HFCD plus metformin (Met) and simvastatin (Sim) (right column). In the first row, tissue sections were stained with hematoxylin and eosin (scale bar: 400 µm). In the second row, tissue was stained with Sirius red (scale bar: 400 µm). The third row represents QuPath analysis of stromal cells highlighted in green (scale bar: 500 µm). (B) Percentage of intact pancreatic acini, (C) pancreatic inflammation score, and (D) percentage of stromal cells in male (left panel) and female (right panel) KC mice fed the control diet (CD), HFCD, HFCD + Met, HFCD + Sim, or HFCD + Met + Sim. Data are presented as scatter plots with bars (mean ± SD). ****p ≤ 0.0001, ***p ≤ 0.001, **p ≤ 0.01, *p ≤ 0.05, ns = not significant.

