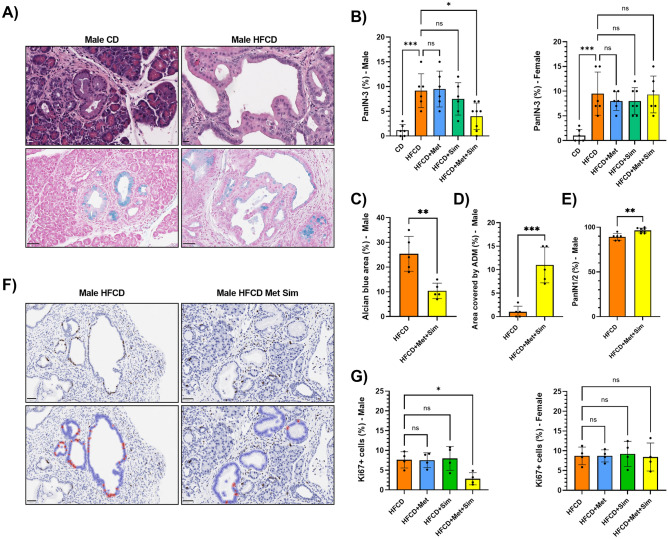
Figure 3.
(A) Representative microscopy images of the pancreas stained with hematoxylin and eosin (top row; scale bar: 20 µm) or Alcian blue (bottom row; scale bar: 50 µm) of male KC mice fed the control diet (CD, left panels) or high fat, high calorie diet (HFCD, right panels). (B) Percentage of PanIN-3 lesions in male (left panel) and female (right panel) KC mice fed the CD, HFCD, HFCD + metformin (Met), HFCD + simvastatin (Sim), or HFCD + Met + Sim. Data are presented as scatter plots with bars (mean ± SD). ***p ≤ 0.001, *p ≤ 0.05, ns = not significant. (C) Percentage of the area of Alcian blue positive lesions in relation to the entire cross section of the pancreas in male KC mice fed the HFCD or HFCD + Met + Sim. Data are presented as scatter plots with bars (mean ± SD). **p ≤ 0.01. (D) Percentage of the area covered by ADM lesions in relation to the entire cross section of the pancreas in male KC mice fed the HFCD or HFCD + Met + Sim. Data are presented as scatter plots with bars (mean ± SD). ***p ≤ 0.001. (E) Percentage of low-grade PanIN-1 and -2 lesions in male KC mice fed the HFCD or HFCD + Met + Sim. Data are presented as scatter plots with bars (mean ± SD). **p ≤ 0.01. (F) Representative microscopy images of the pancreas stained with antibodies against Ki67 (upper row) of male KC mice fed the HFCD (left panel) or HFCD + Met + Sim (right panel) (scale bar: 50 µm). Brown staining indicates positivity for Ki67. Lower row represents QuPath images for automatic quantification of Ki67-positive PanIN cells of the same images shown in the top row. (G) Percentage of Ki67-positive PanIN cells in male (left panel) and female (right panel) KC mice fed the HFCD, HFCD + Met, HFCD + Sim, or HFCD + Met + Sim. Data are presented as scatter plots with bars (mean ± SD). *p ≤ 0.05, ns = not significant.

