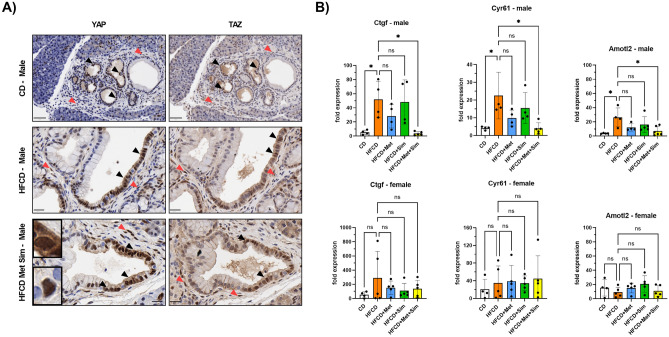
Figure 4.
(A) Representative microscopy images of the pancreas stained with antibodies against YAP (left column) or TAZ (right column) of male KC mice fed the control diet (CD, top row), high fat, high calorie diet (HFCD, middle row), or HFCD + metformin (Met) + simvastatin (Sim) (bottom row). Brown staining indicates positivity for YAP or TAZ. Black arrowheads point to epithelial (PanIN, ADM) cells, and red arrowheads to stromal cells positive for YAP or TAZ (scale bar: 50 µm for top row and 20 µm for middle and bottom row). Upper inset shows a PanIN cell with nuclear and cytoplasmic YAP staining; lower inset depicts a PanIN cell with strong exclusive nuclear YAP staining. (B) Real-time quantitative PCR analysis of Ctgf (left column), Cyr61 (middle column), and Amotl2 (right column) mRNA expression in the pancreas of male (upper row) and female (lower row) KC mice fed the CD, HFCD, HFCD + Met, HFCD + Sim, or HFCD + Met + Sim. *p ≤ 0.05, ns = not significant.

