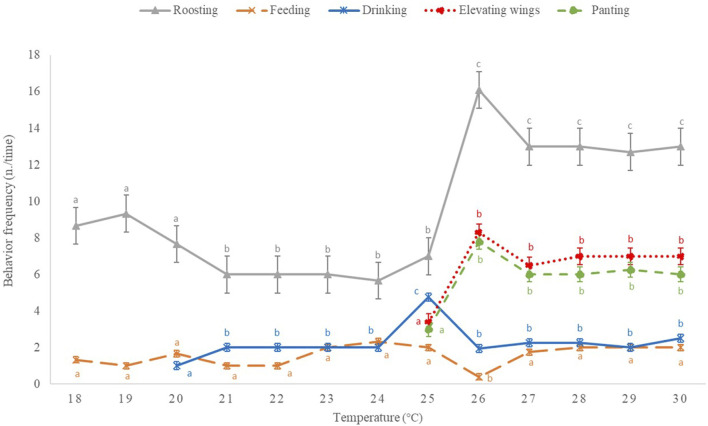
FIGURE 1.
Frequency of the main behaviors expressed (n./time, time = minute) by broiler chickens during the 8 h of temperature increase from 18°C to 30°C (n = 36/group). Results are expressed as mean and standard error of the mean. a-c: For each behavior, different letters indicate significant changes (p < 0.05) in its occurrence according to temperature variation.

