. 2023 Jan 3;41(4):909–919. doi: 10.5534/wjmh.220146

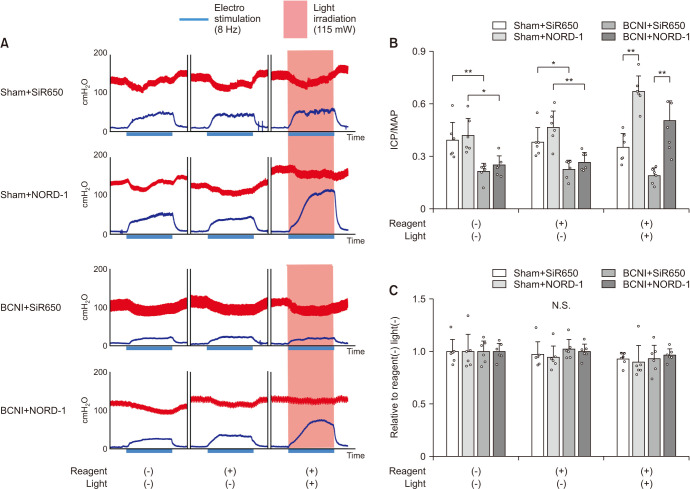
Fig. 4. Representative intracavernous pressure (ICP) and mean arterial pressure (MAP) results. Charts show ICP (blue line) and arterial pressure (red line), in four groups, during electrostimulation without reagent and light, with reagent and without light, and with reagent and light (A). The electrostimulation period is shown by the blue thicker bar along time axis. Red-light irradiation (630–690 nm, 115 mW) period is indicated by the red background. ICP to MAP ratios in each group were measured (B). The ratio of MAP at the end of electrostimulation (End-MAP) to MAP at the start of electrostimulation (Start-MAP) was calculated. End-MAP/Start-MAP ratios in three different conditions were expressed relative to without reagent and light (C). Data are reported as mean±standard deviation (n=6 per group). NS: not significant. *p<0.05, **p<0.01 using Bonferroni’s multiple t-tests.

Fig. 4