FIG. 2.

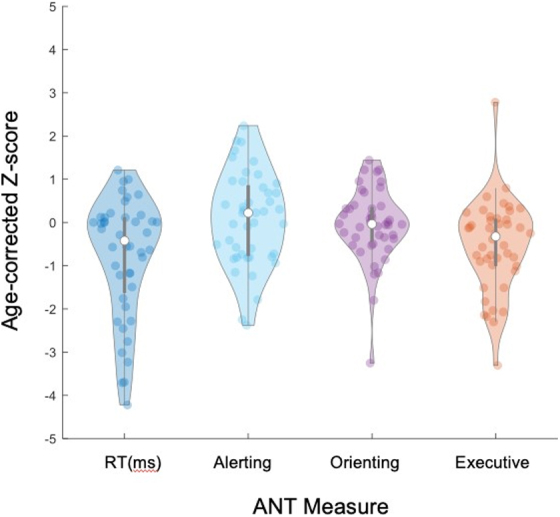
Violin plot demonstrating the distribution of age-corrected z-scores on the Attention Network Test (ANT). Lower (and more negative) z-scores reflect worse performance relative to age expectation.

Violin plot demonstrating the distribution of age-corrected z-scores on the Attention Network Test (ANT). Lower (and more negative) z-scores reflect worse performance relative to age expectation.